The Sims 2 - Part III
by OldGamesCracking
Game Specs
| Name | The Sims 2 |
|---|---|
| Release-Date | 9/2004 |
| Redump ID | 49162 |
| Protection | SafeDisc v3.20.020 |
| Cracked under | Win XP |
| Tested under | Win XP & Win 10 |
| Scene-Crack by | MONEY |
Needed Tools:
- Good Old PC (Windows XP)
- x32dbg
- Ghidra
- ProcMon
- The original Game-CD of course ;)
- Compiler, Dev-IDE and stuff (e.g. VisualStudio)
- The previous articles on SafeDisc
- Koffeinhaltige Kaltgetränke
Disclaimer
- The games are cracked for educational purpose and to regain compatibility with modern systems
- The games are more than 20 years old and can be found freely on the net via e.g. archive.org
- No parts of the game are distributed
Recap
Last time we learned a bit about how SafeDisc tries to keep us from dumping the game by ‘ripping out’ small pieces of information and transfering them to temporary buffers. In this article we will learn about another technique to rip out data from the game. This technique actually fully removes the data so it can’t be found anywhere within the game’s memory space.
An experiment
If you are playing along at home, did you try to dump the unpacked game at the OEP - regardless of what Scylla told us? If not, go ahead and try to! You just have to delete the invalid tree nodes or else Windows won’t event let us open the dumped game in the debugger.
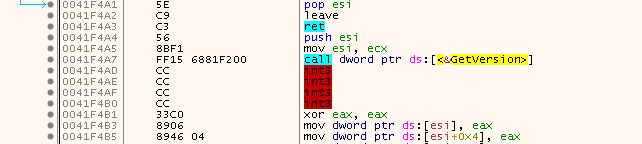
Your expectation at that point might be now that the dumped game will crash because the temporary buffers I described in the last article are missing and for example the intermodular Calls point to invalid thunks. But see for yourself where the game really crashes. So load the dumped game in the debugger, enable all exceptions and hit F9. We end up here:
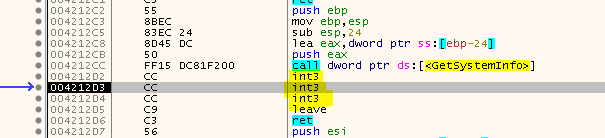
Well, that’s strange. The function starts normally and then - out of nowhere - there are three INT3 instructions. After these three instructions it looks like the function would continue normally again. Usually this is some kind of trickery where an exception handler plus some forged code is used that intentionally creates an exception and thus the control flow is handed over to the exception handler.
But here things seem to be different. Even the original un-dumped game seems to struggle with this and it will crash as it can’t recover from the exception. You can try this for yourself, just don’t stop at the OEP and let the game run freely.
But then how is the game able to recover from this under normal conditions? Did we miss a silent debug check? We can check for this if simply start the game normally (without the debugger), then attach to the game while it’s running and have a look at address 0x004212D2. If there are no INT3 then the game was probably messed up because somewhere our debugger was detected.
So let’s attach to the running game and…

What the fuck? Wait a minute, who are you?
Who is debugging the game?
Remember when we manually set the BLT_{PID} event in order to get to the OEP? This event is normally set by an external process (‘~e5.0001’).
Back then one could think that the process was only there to stop us from reaching the OEP but now it gets clear that there is actually a much more complex thing going on and this external process plays a key role in it.
Since it’s debugging the game it will also receive a notification if any exception occurs within the game. So it looks like this is the answer to the previous question on how the game recovers from the INT3 interrupts.
Each time an exception occurs, the control flow is passed to the debug-process which in turn handles the situation and passes the control flow back to the game.
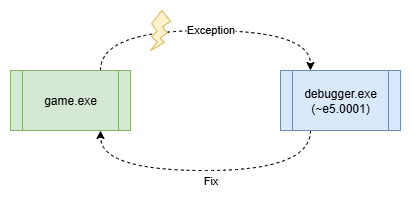
The debug-process has two options to handle the situation:
- ‘Repairing’ the game by replacing the
INT3with the original code (WriteProcessMemoryEx) - Emulating the original code via altering the context of the game (GetThreadContext / SeThreadContext)
Since we want a permanent fix, let’s hope SafeDisc uses the first option and we can recover the so called ‘stolen bytes’.
By the way - as far as I know - this mechanism was (first?) used in the Armadillo Protector where it was called Nanomites, people got used to the name and so I will also call it like that.
You control them, I control you
Ok, what do we have now? We can not open the game.exe in our debugger (x32dbg) and control it via a script since the Nanomites do not get fixed then. But if we let the SafeDisc-Debugger simply do it’s thing we lose control over the situation. Opening the SafeDisc-Debugger in x32dbg might work, but timing it properly will be complicated as the process is created on the fly by the game.exe. So what other options do we have to sneak into the party and take control over the situation?
One very powerful option is DLL Injection combined with function hooking.
Since we want to hook functions in the debugger.exe which is created at runtime, we need to make the DLL injection a 2-staged process. First, we inject a DLL in the game.exe then wait for it to spawn the debugger.exe and inject a second DLL in there as well. The image below which I created for the Stronghold Deluxe article illustrates the process a bit:
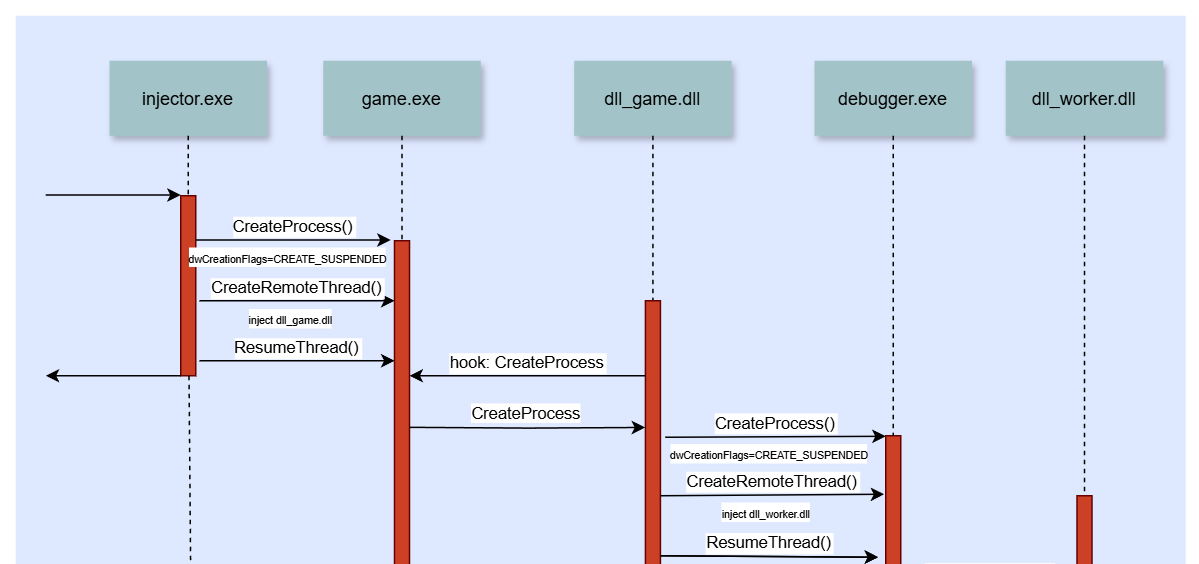
As injector.exe you can use the Simple Injector I created for the Stronghold Deluxe article. The code is straight forward and I won’t explain it in detail here, you can read more about it in the Stronghold Deluxe article or in w4kfu’s Article which served as great inspiration.
For the dll_game.dll I have created a simplified version that you can find here. Note that we will later use another DLL that is slightly more complex but for now, use the “step1” version.
The dll_worker.dll is also a very simple one that will just write a logfile so we can have a first look at the Nanomites and understand them a bit better. The code for the DLL is here.
If it isn’t clear from the code, the dll_game.dll will spawn a console so we can have a bit of debug output and the dll_worker.dll will write the logfile next to the debugger.exe, hence in the %temp% folder (“C:\Documents and Settings\USER\Local Settings\Temp” on my Windows XP machine).
So let’s inject the DLLs and run the game for a bit, then have a look at the worker_log.txt:
Starting Worker
Hooks installed
[Callback_DebugActiveProcess]
	dwProcessId: 0000018C
	entryPoint: 0119F09E
[Callback_WaitForDebugEvent]
	process: 0000018C
	thread: 000004E4
	timeout: FFFFFFFF
	code: 00000001
	exceptionAddress: 004212D2
[Callback_WriteProcessMemory]
	3 bytes @ 004212D2
	8B 45 E0

...
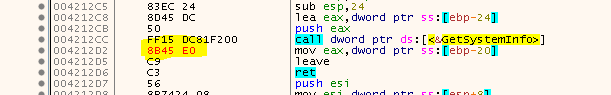
See that? The first exception that the debugger.exe catches is at 0x004212D2 which is exactly the location we saw earlier :) And it repairs the game.exe by writing the three missing bytes to that location. Yay! So we can repair the first Nanomite:
Sift a bit further through the logfile and from time to time you will find some rather unpleasing entries:
[Callback_WaitForDebugEvent]
	process: 0000018C
	thread: 000004E4
	timeout: FFFFFFFF
	code: 00000001
	exceptionAddress: 0041C3FC
[Callback_WaitForDebugEvent]
	process: 0000018C
	thread: 000004E4
	timeout: FFFFFFFF
	code: 00000001
	exceptionAddress: 0041F4AD
[Callback_WaitForDebugEvent]
	process: 0000018C
	thread: 000004E4
	timeout: FFFFFFFF
	code: 00000001
	exceptionAddress: 0041F4AF
[Callback_WaitForDebugEvent]
	process: 0000018C
	thread: 000004E4
	timeout: FFFFFFFF
	code: 00000001
	exceptionAddress: 00418767
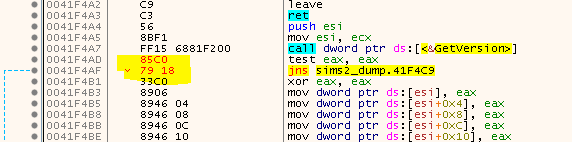
So, we got multiple exceptions and if you have a look at the given addresses you will see that they are indeed Nanomites, but there is no corresponding WriteProcessMemory. For example we get two consecutive exceptions for 0041F4AD and 0041F4AF:
But if the bytes were not written back then how did the game not crash? Well, the answer is simple, SafeDisc does not always write the bytes back, sometimes it just emulates the instructions and changes the thread context instead.
Does that mean we have lost the battle already? Not quite ;) There are at least two options:
- Reverse engineer how SafeDisc stores and emulates the Nanomites
- Force SafeDisc into restoring the bytes every time
While the first option is the kewl and pro way of doing things, it will definitely send you down a rabbit hole that might eat up all your free time, sleep and will to live, so let’s not do this (for now)… Yep, that’s a foreshadowing :)
I admit that it might not be clear at that moment that the second option even exists. Luckily I had heard about it in w4kfu’s Article and since I had previously worked on SafeDisc I kinda knew where to look out for this option.
Generally speaking, to find the place where the decision is made to write the bytes back or not is somewhere between the call to WaitForDebugEvent and WriteProcessMemory.
Since you can attach to the debugger.exe with x32dbg while it is running you can step through the SafeDisc code and have an in-depth look at things. I also highly recommend using Ghidra for that task, too.
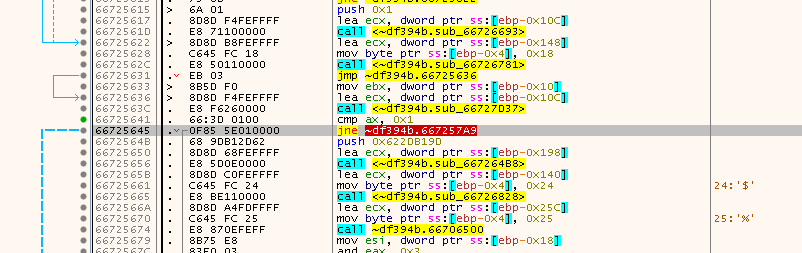
At one point you should land here:
Or as seen in Ghidra (already named a few things):
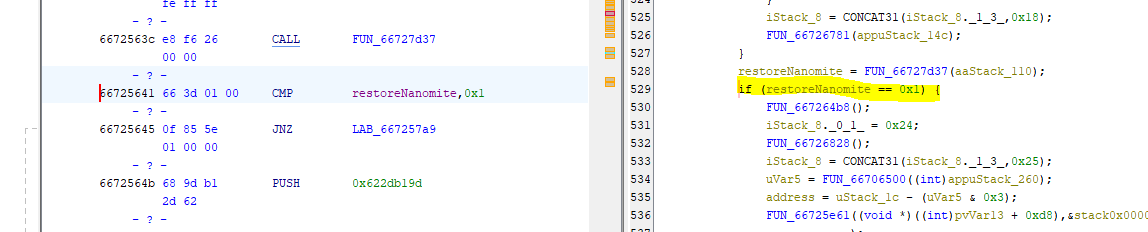
So let’s patch that out. There are multiple ways to do that:
- NOP-ing out the jump
- Change the JNE to a JMP and alter the destination address to point right after the jump (jmp 0x6672564B)
- Change “CMP AX, 1” to “XOR AX, AX”
- …
In the DLL Code, we add the following:
DWORD oldProtect;
VirtualProtect((LPVOID)0x66725641, sizeof(DWORD), PAGE_READWRITE, &oldProtect);

/** Option 3 */
*(DWORD*)0x66725641 = 0x90C03166;  // XOR AX, AX; NOP

VirtualProtect((LPVOID)0x66725641, sizeof(DWORD), oldProtect, &oldProtect);

FlushInstructionCache(GetCurrentProcess(), NULL, NULL);
And now the log should look as follows:
[Callback_WaitForDebugEvent]
	process: 000002F0
	thread: 0000018C
	timeout: FFFFFFFF
	code: 00000001
	exceptionAddress: 0041F4AD
[Callback_WriteProcessMemory]
	2 bytes @ 0041F4AD
	85 C0
[Callback_WaitForDebugEvent]
	process: 000002F0
	thread: 0000018C
	timeout: FFFFFFFF
	code: 00000001
	exceptionAddress: 0041F4AF
[Callback_WriteProcessMemory]
	2 bytes @ 0041F4AF
	79 18
Or in other words, the instructions from above can be repaired to the following:
Sooo, we have fixed a handfull of Nanomites, but how do we progress from here?
Well, you could play the game now, log all occurring Nanomites to a file and patch the dumped game.exe with it. In theory, if you play the game for long enough and extensive enough, you should come across all Nanomites sooner or later. But that might be a tedious task and it won’t guarantee you to find all Nanomites, so we need a better approach!
The idea that w4kfu presented is actually quite ingenious. You simply find out the location of all Nanomites and spawn a new thread on each of them. The thread will then instantly raise an exception which is caught by the SafeDisc debugger. With a bit of code magic you can restore all Nanomites with this method.
But then another question arises immedeately: How do we actually find all Nanomites? Simply scanning the text section for INT3 (0xCC) won’t work mainly for two reasons:
-
A 0xCC can occur within other instructions.

-
The compiler (probably Visual Studio) likes to add 0xCCs between compilation units, probably to align the start of a function to an address that is divisible by 16. If you try to let SafeDisc interpret these as Nanomites all sorts of strange things may happen. Usually a crash or - even worse - it will generate strange instructions that sometimes mess up the other good instructions.
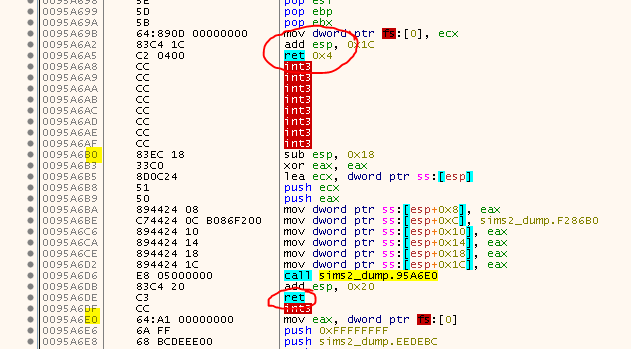
See how there is a
RETbefore theINT3s and how the next ‘good’ instructions are aligned? These probably aren’t Nanomites but rather some stuffing/padding bytes.
Ok, so a simple searchpattern won’t help us and parsing the instructions to find the INT3 won’t help us either. We need something a bit more advanced. In Part 4 we will talk a bit about the aproach I came up with.
Aftermath
While working on my tool and looking through the logs, I realized that even with the patch from above after some while, the Nanomites stopped beeing restored. It took me some time to figure out the cause, but enventually I figured out that actually two more patches are needed.
First, there is a counter that will increase for every INT3 that turns out to be something else but not a Nanomite. We need to make sure to prevent this counter from increasing. This is a bit in contrast to what I said previously, because if we can reset the counter, why bother whith finding only ‘good’ Nanomites in the first place? Well, the answer is simple: I tried to avoid finding ‘bad’ Nanomites, but that turned out to be somewhat complicated so in the end I opted to go with a ‘best effort’ approach and for everything else, I fall back to this patch.
The patch is simple, just skip this call. Inside the call, the counter is incremented:
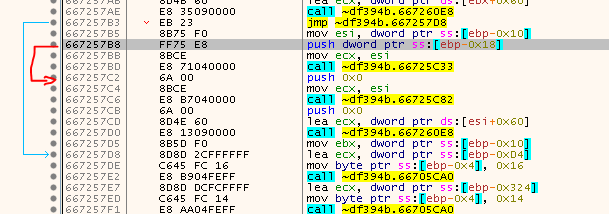
Or in other words:
*(WORD*)0x667257B8 = (WORD)0x08EB;
The second thing we need to handle is the fact that there is a limit on how many Nanomites are written back. After the limit has been reached, no more Nanomites will be written back and instead they will only be emulated. I found out that the counter is incremented here:
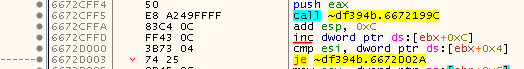
Simply also jump that instruction:
*(WORD*)0x6672CFFD = (WORD)0x01EB;
tags: The Sims 2 - Game Cracking - Reverse Engineering - SafeDisc - Nanomites - DLL Injection - Self Debugging