Grand Theft Auto: San Andreas
by OldGamesCracking
Game Specs
| Name | Grand Theft Auto: San Andreas |
|---|---|
| Release-Date | 06/2005 |
| Redump ID | 28223 |
| Protection | SecuROM v7.01.0003 |
| Cracked under | Win 10 |
| Tested under | Win 10 |
| Scene-Crack by | HOODLUM |

Needed Tools:
- x32dbg
- Python and x64dbg-automate
- The articles by AnonymouS, deroko, Human/MiNT and 2kAD are a good read!
- The patched version of Scylla
- ASMSim
- The original Game-CD of course ;)
Disclaimer
- The games are cracked for educational purpose and to regain compatibility with modern systems
- The games are more than 20 years old and can be found freely on the net via e.g. archive.org
- No parts of the game are distributed
Intro
This is probably one of my most favorite games of all time. I have probably played it several hundred hours and still play it today sometimes. After cracking GTA III and Vice City it was just a matter of time until I would have a look a this game.
Killing the Anti-Debugging stuff
As far as I can tell, the game uses at least three different methods to detect the presence of a debugger / analyzing tool:
- It checks the BeingDebugged-Flag.
- It tries to open various files/drivers (“\\.\regmon”, “\\.\filemon”, “\\.\ntice”, “\\.\sice”)
- It tries to find a debugger via FindWindowExA (“18467-41”, “OLLYDBG”, “kk1”, “TIdaWindow”)
The last two are not interesting to us as they detect old debuggers, so we only need to kill the first check, which can be done easily.
Finding the OEP
In order to find the OEP, as always, I started to poke around a bit. Setting breakpoints here and there, but this version of SecuROM seems to detect the presence of breakpoints or will delete them on it’s own as it makes heavy use of exception handlers. After some checks, I realized that while it will detect ‘first level’ breakpoints in kernel32.dll, it won’t detect them in kernelbase.dll. So instead of placing e.g. a breakpoint on kernel32.VirtualProtect, one could use kernelbase.VirtualProtect.
Then I noticed that the entry point is outside of the text section, which means we can try to find the OEP by a classic section-hop to the text-section.
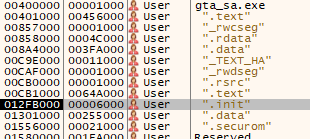
The right moment to install the memory breakpoint for the section-hop-detection is right after the call to VirtualProtect with the base-address of the text-section as parameter.
Putting the ideas together, I ended up with this simple script which works flawlessly every time. Just be patient, it takes some time (~10s) before the game starts as the breakpoint is hit many times in the background and the debugger needs to handle the events.
Fixing AcLayers stuff
In order to dump the game now, we first need to fix the imports that were proxied through AcLayers. In my case, I had 3 of these:
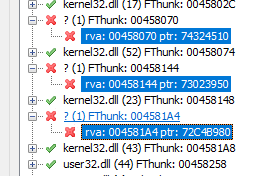
As discussed in previous articles, we can usually fix them by having a look at the debug log within the stubs:
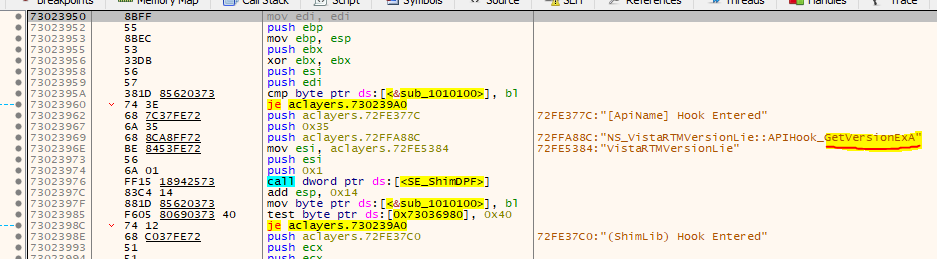
By this we can figure out that IAT-Address 0x00858070 should point to Kernel32.LoadLibraryA and 0x00858144 should point to Kernel32.GetVersionExA. The third one at 0x008581A4 was a bit tricky. I figured it out by stepping through the function and saw that it really wants to call Kernel32.VirtualAlloc.
In order to dump the game, use the patched version of Scylla from the Vice City article as they’ve used the same trick to bloat the DOS header which bugs Scylla.
Mangled imports
Although it looks like all imports are fine, if we try to start the dumped game now, it will crash. Upon closer inspection we realize that some interesting code-splicing is going on.
At address 0x00406C34 we have a seemingly normal call:

But once we step in, we directly land on a jump to a quite distant location:

In fact, if you follow that jump, the code looks kinda normal again, but see in which section we are now:
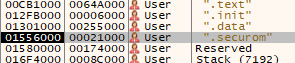
So it tells us right away that we are dealing with some SecuROM stuff now. Stepping a bit further through the code, we land on this bit:
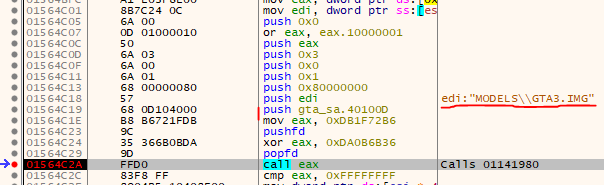
Judging by the parameters of the function and the value in EDI, we can already guess that this tries to call CreateFileA via a stub at 0x01141980.
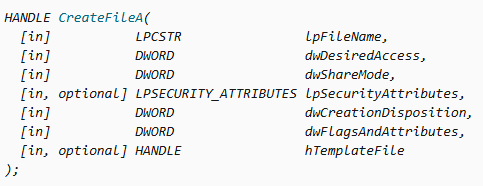
But upon closer inspection, we see that one additional parameter was added. It’s a pointer to 0x040100D. Having a look at that address we find a pointer which in turn points to seemingly meaningless binary data - strange. So, let’s progress further and step into the Call. We see some good old PUSHAD and PUSHFD right away, maybe we can use that to find the end of the routine (Hardware Breakpoint on top of stack). And yes, indeed - we break right at a RET and the next element on the stack is the address of CreateFileA - just as we expected.
I stepped a bit through the stub routine and realized that it is some kind of virtual machine. The first parameter that is passed to the stub routine (0x040100D) is a pointer to the code that is beeing executed - hence the ‘Program’ of the VM.
You can imagine this as the following code:
HANDLE hFile = VMEnter(&VMProgram_CreateFileA, name, access, mode, attributes, disposition, flags, template);
Ok, so this looks fairly simple to fix at first, but how can we find all the Calls to that stub? If you put a breakpoint on the first instruction, you will find out quite fast, that this routine is called from different locations, but the setup looks kinda different each time:
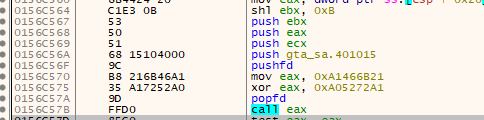
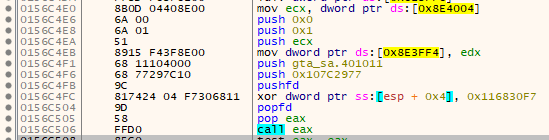
This one uses a nicely placed JMP -1 to obfuscate the CALL (recycling the FF byte):
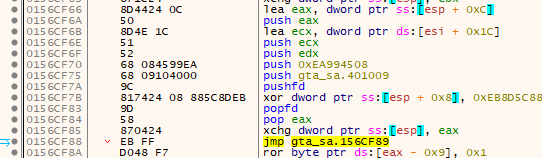
This makes it hard to find each and every place that would need patching by just using a simple search pattern.
So maybe we need an approach that will leave the original CALL intact and instead alter the content of the stub. Time to figure out it’s inner mechanisms… and down the rabbit hole we go ;)
Virtual machines, son!
So, we know already that the VMEnter function gets one parameter. Let’s see what it’s exact meaning is.
But wait a second! The VM and it’s handlers are all obfuscated and filled with junk code. Admittedly, the junk code has a certain ‘rhythm’ and after stepping though it, you kinda get used to it, or to put it in the words of deroko:
[..] obsfucation here doesn’t help that much to stop attacker, as after a few minutes you get used to obsfucation and simply you don’t even see it [..]
But still, as I didn’t wanted to waste too much time, I decided for this article, I would like to get hold of a new toy that would spare my eyes from seeing too much junk code, so I bought a few tokens, threw them at the AI and let it create ASMSim. With that we can have a much clearer look at all the fuzz that’s going on.
A few spoilers before we start:
- The SecuROM VM is a register-based VM with a threaded dispatcher
- Theoreticly, there are up to 256 possible instructions, but only 83 are used and some of them are fake (they point to random locations within other handlers code)
- At the end of each handler, a
JMP <reg>or aPUSH <addr>; RETis used to jump to the next handler (that’s the nature of the threaded dispatcher approach) - The instructions that are emulated mostly represent real x86 counterparts, but there are a few special ones sprinkled in (mainly anti-tracing stuff)
- Some instructions are also doubled up and use a slightly different operands/encryption scheme. Have a look at vm.py for details on what each handler does
- The instructions are either 4, 8 or 10 bytes long, depending on whether a simple instruction like
MOV EAX, EBXis emulated or if an immediate value is taken into account, likeMOV EAX, 0x12345678 - The instructions are ‘encrypted’. Decryption is done via a running key, so it’s not possible to decode a random instruction within the program without decrypting all previous instructions first
- The whole VM code was made location-independend. The only fixpoint is the address of VMEnter which is also determined at runtime (CALL +0; POP reg). Everything else is relative to that address, so the Handlers-Array really just holds offsets to VMEnter instead of absolute addresses
- EBX holds the address to VM.Data throughout the whole run
- The general structure of the VM-Context and the instructions can be found here. Refer to that if you are looking for a certain offset into the structures
Getting the emulator to work properly was an iterative task and looked as follows:
- Let the emulator run until it crashed (mostly because of an unknown instruction)
- Use ASMSim to simplify the handler
- Understand the handler
- Implemented it in the Emulator
- Rinse and repeat
For anyone playing along at home, this is what every handler more or less does:
- Get the address of VM.Data (it’s in the EBX register at all times)
- Get the current instruction via VM.VMEnter + VM.IP_Offset
- Get the operands or the immediate (depending on the opcode)
- Transform the running key (and safe current key)
- Decrypt the Operands, Immediate and NextOpCode via the current key
- Emulate the instruction
- Advance the IP by the size of the instruction or point it to a new location in case of a branch
- Get the decrypted offset to the next handler via VM.VMEnter + VM.Handlers_Offset + NextOpCode
- Decrypt the offset via the lowest byte of the Processor Version Information (CPUID with EAX=1)
- Jump to the next handler via VM.VMEnter + offset
The exact order of the steps, how the key is transformed and which operand is used for what depends on the handler, but generally speaking there are more or less two variants. Have a look at vm.py for the exact details. I think there is even a third ‘flavor’ of instructions, but they are not used during runtime of the game and are only seen in VM-programs invoked by the loader.
Here is an annotated example of such a handler after beeing simplified. It emulates MOV reg, reg:
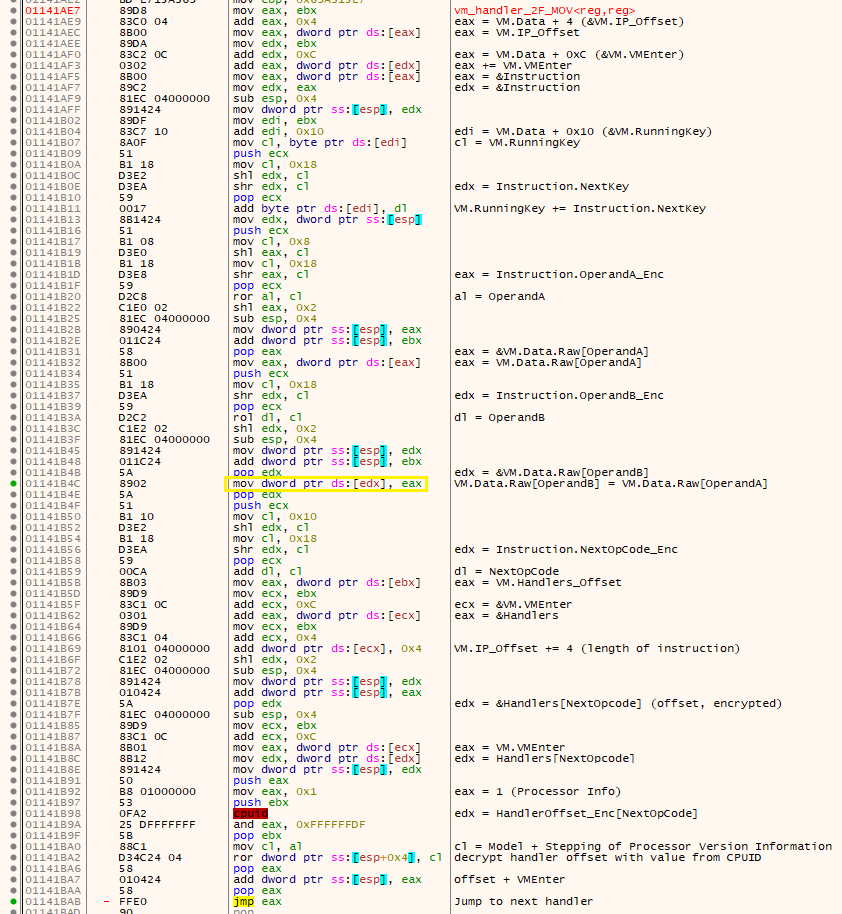
If you have paid close attention, you should have realized that so far no temporary buffer was involved, neither the VM code nor the handlers or the VMProgram are in any location that will be lost once we have dumped the game, so why bother? Well, the nasty trick here is to use CPUID as a key. This will make sure that as soon as we try to run the game on another computer with a different CPU model, it will crash. Actually, this is rather easy to patch. We can just change the parameter that is passed to CPUID with the expected value and NOP-out the CPUID instruction, hard-baking the value into the code:

This is the method described by Human/MiNT. He even wrote a nice script for that. Although he did not patch-out the CPUID, but changed the following AND EDX, 0xffffffdf to a MOV EAX, <CPUID_VAL> which is even better. But since I’m expecting that at some point in the future, we will be forced to fully understand the VM, why not have a deeper look now ? :)
So, now that we know the general structure of the VM, let’s parse the aforementioned program at 0x040100D. This is the annotated listing:
; <val> means VM.Data[val], hence a scratch register at the given offset in the VM.Data structure

; <0x61> = VM.Context
MOV <0x61>, <0x07>
; <0x61> = &VM.Context.ReturnAddress
ADD <0x61>, 0x24
; <0x61> = VM.Context.ReturnAddress
MOV <0x61>, mem:[<0x61>]
; <0x36> = VM.Context
MOV <0x36>, <0x07>
; <0x36> = &VM.Context.arg1
ADD <0x36>, 0x28
; &VM.Context.arg1 = VM.Context.ReturnAddress (Replace additional argument with return address)
MOV mem:[<0x36>], <0x61>
NOP ; #2 (Check TRAP flag)
; <0x36> = VM.Context
MOV <0x36>, <0x07>
; <0x36> = &VM.Context.ReturnAddress
ADD <0x36>, 0x24
; <0x23> = 0x8580A0 (Address of IAT slot)
MOV <0x23>, 0x8580A0
; <0x23> = [0x8580A0] (Gives the proc address)
MOV <0x23>, mem:[<0x23>]
; VM.Context.ReturnAddress = ProcAddress
MOV mem:[<0x36>], <0x23>
RET
What it does is quite easy. It will remove the extra function parameter (arg1 aka VMProgram) by overwriting it with the return address and then overwriting the return address (arg0) with a hardcoded value from the IAT then jumps there via a RET (consuming the extra value on the stack). The IAT slot address is hardcoded. In this case it’s 0x8580A0 which is exactly where &CreateFileA is located.
So, this is one import down. Where are the others? Go ahead and place a breakpoint on VMEnter, you should realize that all (except one) passed programs are from the same area in memory:
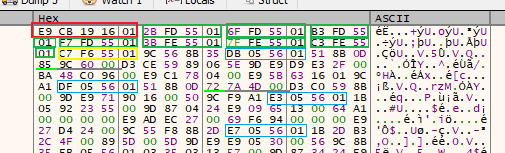
The bytes marked in red are a JMP that jumps to valid code and the bytes after the yellow area are also valid code (the addresses in blue are part of that code). So it really boils down to these 8 addresses. The yellow is special: Although it’s from the same address-space, it’s something else, I think it’s a leftover from the loader, and we do not need to care, so it’s only the seven green addresses.
I let my parser run and figured out that these are all VM-programs performing the exact same task of jumping to an address in the IAT. The addresses are:
00401005 -> 00858074 -> &GetFileSize
00401009 -> 00858084 -> &GetOverlappedResult
0040100D -> 008580A0 -> &CreateFileA
00401011 -> 0085808C -> &ReleaseSemaphore
00401015 -> 00858098 -> &ReadFile
00401019 -> 00858090 -> &SetFilePointer
0040101D -> 00858098 -> &ReadFile (doubled)
Sooo, we are able to extract the IAT-slot address from the VM-programs, but how do we remove the VM itself? Well, that’s easy :) We just patch the addresses at 00401005 .. 0040101D to the IAT-slot addresses and patch the first few bytes of the VMEnter function so that it just looks up the address, or in other words:

Can we dump now?
Remember when I said that all VM-programs passed to VMEnter are from the same address space? Well, not exactly. There is one located at 0x013961EC. Let’s have a look at where it is used. For example, at 0x00748DED we see an ordinary CALL, so far nothing special:

This then jumps to another CALL:


And finally we see the VM setup:

It took quite some time to interpret all emulated instructions correctly and adapt my emulator, but eventually it started to make sense. Then it was time to interpret the program itself. You can find an annotated listing here. It’s quite long, but up until address 5DFA it does nothing interesting. This is the summary:
- From 0026 to 0046 it loops 20 times over a few
NOPinstructions. The lastNOPchecks the trap flag and is probably an anti-tracer measure - From 0050 to 0098 and 00A2 to 00EA we have more loops. This time only plain
NOPs are used - From 00F4 to 01BA a checksum of all handlers is calculated and checked against a hardcoded value
So far this is just noise, and we can ignore it. The hardest part was to realize that all instructions, like MOV <0x04>, ... reset the running key to a new value, but once the emulator was adapted, it ran smoothly.
Finally, at 5DFA we see the real purpose of the program:
- It retrieves a key from ImageBase + 0xF9622C
- At ImageBase + 0xF979BC it retrieves a pointer to a struct. This struct is EncryptedFunctions_t (see sr_structs.h)
- The struct holds 500 FunctionData_t objects which have the following layout:
typedef struct
{
    BYTE StolenBytes_Enc[8];
    SIZE_T DataLen_Enc;
    BYTE Unused1[4];
    DWORD DataKey_Enc;
    BYTE Unused2[0x1C];
    DWORD ReturnAddress_Enc;
} FunctionData_t;
- If ReturReturnAddress_Enc XOR the Key matches the ‘inner’ return address of the Call we saw at 01560FA0 (accessed by VM.Data.Context->arg2), we have found the correct FunctionData entry
- In this case, the call is first overwritten with the StolenBytes and then DataLen bytes, starting at the call address, are decrypted with the DataKey. So the stolen bytes are decrypted twice
- Finally, the VM jumps (exits) back to the address of the call, but this time it’s the unencrypted function that the game tried to call initially
So this VM-program simply restores some encrypted function on the fly. Luckily, the ReturnAddress member is en/decrypted with a constant key and is compared to the plain return address on the stack, there is no hashing or other stuff going on, which means we can figure out the Call-site by simply subtracting 5 from the decrypted ReturnAddress. To reconstruct all functions, we simply iterate over all entries ourselves and decrypt the functions manually. As far as I can tell, there are no fake-entries, just make sure that ReturnAddress_Enc is non-zero. There are a total of 21 encrypted functions.
For more details have a look at game_fixer.py.
Can we dump now? Part II
The dumped game seems to run now for a few seconds, but as soon as it tries to load the intro movie, it will crash. Time to figure out why. I tracked down the issue to two things. The easy one first.
At 01564BE8 we find a CALL to a little setup function:
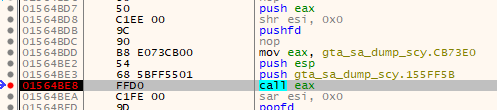

The CALL at the end (calling relative by 0x01422EA0) is what causes the issue. Under normal conditions, this would call a little stub that then jumps back to some function at 0x01166B30. Unfortunately, the stub is in a temp buffer and so it breaks. Let’s have a look at the stub:

It just installs a hard-coded address on the stack and then jumps to that, so very easy to fix. Initially I thought there might be more of these, so I’ve written a little script to fix these “Jump Bridges”, but it turned out this is the only one.
Once that was out of the way, I re-dumped the game and it crashed agin :( Interestingly it crashed shortly after reaching the function that the stub we saw before jumped to. Seems like there is more going on…
Recursive Virtual machines, son!
After a few minutes of scratching my head and comparing the un-dumped with my dumped game, I realized that there was nothing wrong with the code, but rather with the underlaying data. Have a close look at the function at 0x01166B30 (this is where the stub jumps):
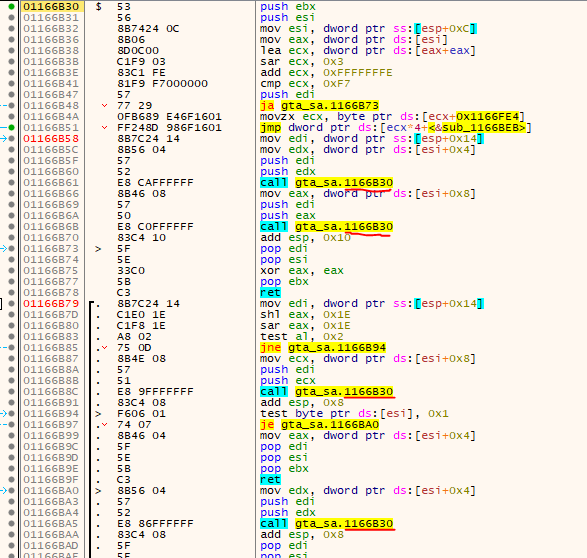
See how it will call itself recursively? It gets two values passed, the first one being a pointer to some data (0x0155FF5B), the second one being the value of ESP at the time of calling the setup function (you can see it in the image above at 0x01564BE2). Stepping through the function and having a look at the passed data revealed why the game crashed:

While the mentioned address of 0x0155FF5B points to within the game’s image, its content holds two pointers that were originally located in temporary buffers and are now lost. Time to dig into the mess and see how we can deal with that :)
Luckily the code is pretty readable and after a few minutes of stepping through the code and making some notes, I figured out what its purpose is. It’s a so-called Tree-Walking-Interpreter, also called AST-Interpreter (Abstract syntax tree). In his article, 2kAD called it a “recursive VM” (RVM), although that’s not fully true. But also not fully wrong, so I will stick with that name :)
What this RVM/Interpreter will do now is very simple. In it’s simplest form it will represent a simple mathematical term like (3 + 4) * 5, but it can also be used to represent a complete program, hence the feeling that we are dealing with a VM.
In the example above, the tree would look as follows:
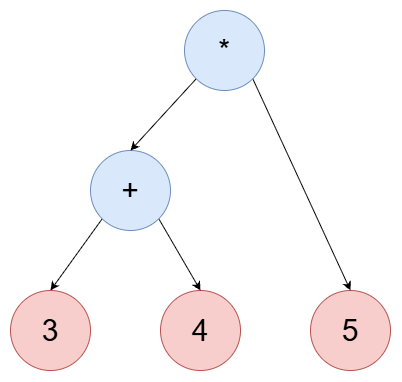
You can write this in Polish notation as mul(add(3,4),5).
As you can see in the image above, the value of each node is either the result of an operation performed on its children, or it’s a leaf-node (constant value). To parse the tree, you recursively go through the tree - depth-first - and then “bubble up” the result. Let’s see that in the code:
First, let’s have a look at how a node is stored:
typedef struct rvm_node
{
    BOOL LeftIsConst : 1;
    BOOL RightIsConst : 1;
    DWORD Instruction : 29;
    BOOL Unknown : 1;
    union
    {
        rvm_node *Child;
        DWORD Value;
    } Left;
    union
    {
        rvm_node *Child;
        DWORD Value;
    } Right;
} RVM_NODE_t;
So it’s a simple 3-DWORD structure. The ADD operation for example looks as follows:
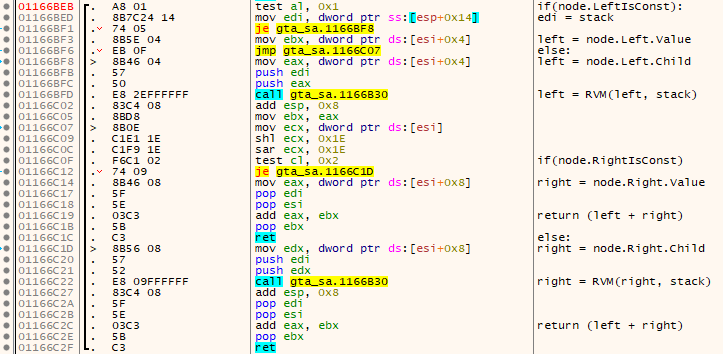
Of course, they didn’t make it super easy to get the true value. For example, the previsously seen Program/AST at 0x0155FF5B would give:
('ROR', ('DO_THEN_RETURN', ('ROR', 2147484149, 26), ('XOR', 234902877, 21853)), ('ROL', ('SUB', 30411, 17611), ('XOR', ('DO_THEN_RETURN', None, ('ROL', ('DO_THEN_RETURN', None, 603980247), 6)), ('SUB', 8418, ('ROR', ('ROR', 2958032890, 28), ('DO_THEN_RETURN', None, 24))))))
But with a bit of constant-folding, we find out that this term completely collapses to the constant value 7 :)
At - for example, 0155FF13 - we find another term that - after simplifying - gives:
('DO_THEN_RETURN', ('STACK_WRITE_AND_RETURN', 2, ('ADD', 802582397, ('STACK_FETCH', None, 2))), 4187390825)
Which could be described in x86 assembly as:
mov eax, [esp+8]
add eax, 0x2FD66F7D
mov [esp+8], eax
mov eax, 0xF9968369h
Note that EAX is used to return the value. Indices are full DWORDs, thats why e.g. ('STACK_FETCH', None, 2) translates to mov eax, [esp+8].
Ok, how do we progress from here? We have three options now.
- Find and replace all calls to the Interpreter with the resulting x86 code (inline patch)
- Find a place where we can permanently store the trees, leaving everything else untouched
- Parse the tree, generate the equivalent x86 code and modify the parser so that it will act as a dispatcher by jumping to the generated code (which you can put in the address range of the Interpreter, as it’s not needed anymore)
Option 1 is probably the hardest, as you need to find all calls to the Interpreter and, since they have obfuscated the Calls by splitting the Tree-address in multiple instructions sometimes, this becomes an annoying task. Also, it’s not always easy to fit the code in there.
Option 2 is what HOODLUM did in their crack, but I have absolutely no idea how they pulled that off since they have placed the trees in the .init section and I don’t know which parts of that section are needed by the game and which aren’t. My guess would be that this section is only needed by the SecuROM loader and is free to use once the OEP is reached, but I didn’t bother checking. Nevertheless, it’s the most robust solution as you can’t make any mistakes by interpreting the tree incorrectly, you just need to copy it byte-for-byte and then apply a constant offset to the pointer addresses.
Option 3 is what I went for :)
In all three cases, we just need to answer the same question: Where are all the trees? Luckily, with a bit of taking a close look, we see that the trees are all nicely lined up in memory, they have a certain pattern that you can spot easily:
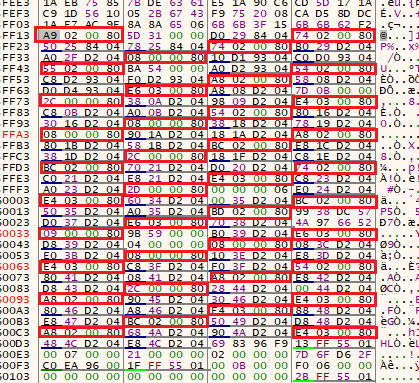
It’s always an instruction followed by two constants or a pointer to the child node (as seen previously in RVM_NODE_t).
With this out of the way we can finally dump the game and it runs perfectly without the CD, no CD-Checks we need to patch this time ;) Does it have some silent checks? Who knows, I bet so, but I will conclude the article at this point and might return later if needed.
Conclusion
This early version of SecuROM 7 wasn’t all that hard to crack, one could have get away with simply patching a few CPUID, repairing the jump bridge and placing the AST in a non-temporary location, I just went the long way. Let’s hope it pays out ;)
tags: GTA SA - San Andreas - Grand Theft Auto: San Andreas - Game Cracking - Reverse Engineering - SecuROM