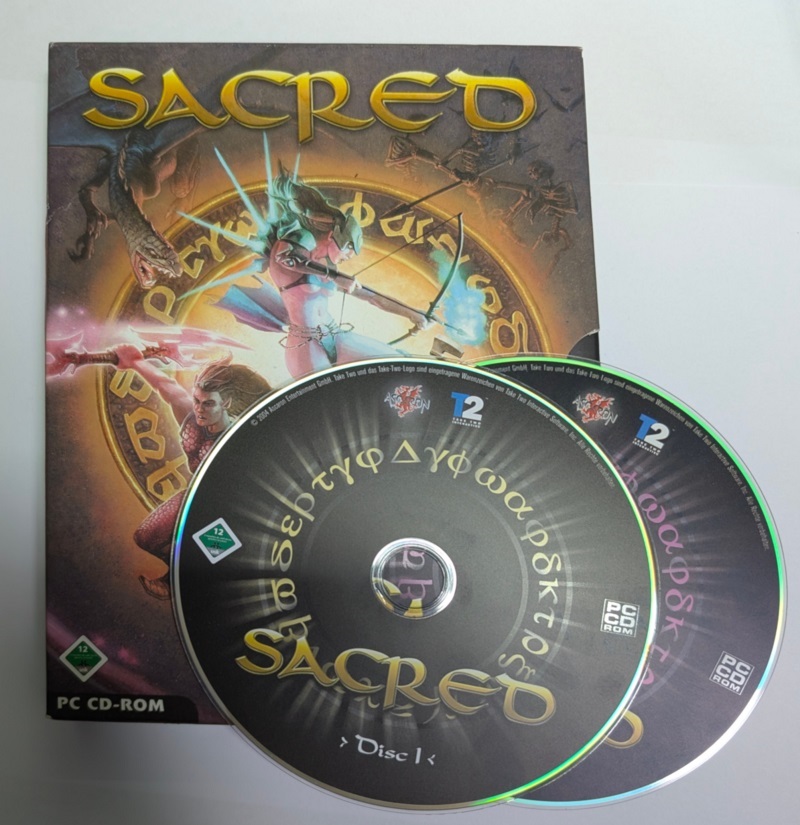
Sacred
by OldGamesCracking
Game Specs
| Name | Sacred |
|---|---|
| Release-Date | 02/2004 |
| Redump ID | 70362 |
| Protection | ProtectCD 5.9.5.996 |
| Cracked under | Win XP + Win 10 |
| Tested under | Win 10 |
| Scene-Crack by | SOULDRiNKER |
Needed Tools:
- Good Old PC (Windows XP)
- x32dbg (June 2025 version)
- The original Game-CD of course ;)
- Compiler, Dev-IDE and stuff (e.g. VisualStudio)
- Spaßgetränke
Disclaimer
- The games are cracked for educational purpose and to regain compatibility with modern systems
- The games are more than 20 years old and can be found freely on the net via e.g. archive.org
- No parts of the game are distributed
How to Crack
This protection uses a few tricks that we will defeat one by one. Firstly, as you will realize very shortly, the whole loader code was stuffed with meaningless junk code and Jumps/Calls that lead to nowhere. Stepping through the code is a real pain in the ass and you will loose track after a few minutes, don’t even try it. For every ‘good’ instruction there are around 100 junk-instructions. Maybe one could write some kind of code-cleaner as the junk code has some kind of repeating pattern, but I didn’t bother as we don’t need it.
Next, the loader uses intentionally thrown exceptions and SEHs to make the progam-flow even more confusing.
When a debugger is detected (via PEB.BeingDebugged), it won’t show an error message it will just crash somewhere.
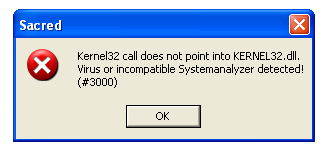
Also, another thing that’s rather annoying is the fact that it will detect the presence of ProcMon. Interestingly in this case, we will get an error message:
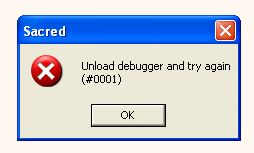
I tried to figure out different things, but I was unable to pin down the exact mechanism it uses to detect ProcMon… Anyways, let’s move on and try to solve things differently then :)
Load the game in the debugger and use ScyllaHide or the hide command to clear the BeingDebugged-Flag. This is enough so that the protection won’t detect us (it checks for the presence of SoftIce tho). Make sure to pass all exceptions to the program. After a few moments of fiddling aroung, I realized that the game will eventually “break loose” from the debugger. This means that another independent process was created and the game is now running from this process. Luckily, at that stage of the loader it was still possible to place a breakpoint at CreateProcessA so we can see what process is started. Just make sure to not place the breakpoint on the first instruction, place it on the second instruction. This can be done via bp CreateProcessA + dis.len(CreateProcessA)

Ok, this is strange. The game starts itself over again. I couldn’t figure out how the second process is able to detect whether it is the first or the second process, but we actually don’t need this information, we just have to figure out a way to debug the second process as well. Luckily, the trick is simple. Just change the dwCreationFlags from DETACHED_PROCESS (0x00000008) to DETACHED_PROCESS | CREATE_SUSPENDED (0x0000000C) to start the second process in suspended state. You can automate this quite easily via the following script:
bpc
bp CreateProcessA + dis.len(CreateProcessA)
erun
dword:[esp+0x18] = 0x0c
rtr
Now that we can get our hands on the second process, let’s find a way to make it to the OEP. But that’s easier said then done. It is nearly impossible to place a breakpoint somewhere without things going south. Also, Hardware breakpoints will be deleted :( I’m guessing the scene-guys back then used a Kernel-Mode debugger, but I was too lazy to get that up and running ;) So let’s try to gather more information about the loader to find a good attack-vector ;)
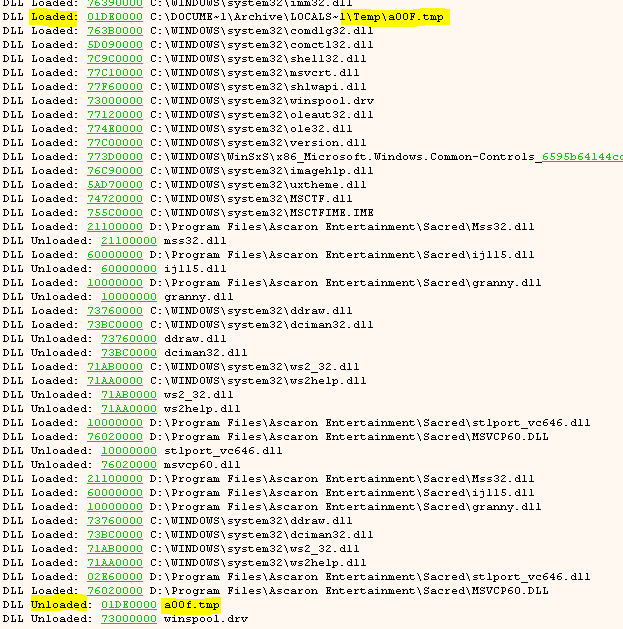
Eventually I figured out that the loader drops multiple files to the Temp-folder. These files are named a00xxx.tmp, PCD65Xyy.sys (with xxxx and yy being incremented with every start). Conveniently, x64dbg tells us, a00xxx.tmp is loaded as DLL at a very early stage of the loading process. Then, right before the game starts, it is unloaded. So this file seems to be kinda important for the loader.
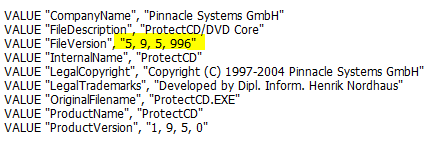
Opening the file in ResourceHacker reveals that it is indeed ProtectCD we are dealing with:

It probably also reveals the exact version of v5.9.5.996:
And we can find many dialogs. One of these is the window that pops up when the CD is being checked with a little easteregg (“Datt dauat hallt” = “This takes some time” in Low German).
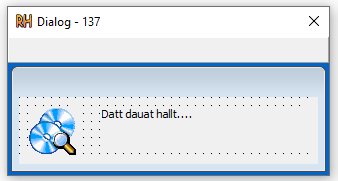
Back on topic… now that we know that a00xxx.tmp seems to be responsible for performing the CD-Check, let’s try to hop into the actions when it gets unloaded as this can’t be too far from the OEP. The question is now: how can we manage to do that as we can not place a breakpoint on LoadLibrary/FreeLibrary ? Well, after fiddling around a bit, I found that we can use the underlying LdrLoadDll and LdrUnloadDll in ntdll.dll :) They are officially undocumented but you can find a documentation e.g. here.
So, the plan goes something like that:
- Hook LdrLoadDll and wait for it to load the .tmp file
- Remember the module handle
- Wait for LdrUnloadDll to be called with that handle as parameter
I have written a script for that which will also continue the previously suspended thread:
$ep = mod.entry(mod.main())
$tid = tid()

bpc
bphwc

bp $ep + dis.len($ep)
resumethread $tid
bpc

$load_dll = ntdll.LdrLoadDll
$unload_dll = ntdll.LdrUnloadDll

bp $load_dll

loop_load:
    erun
    $ptr_dll_name = dword:[esp+0x0C]
    $dll_name = dword:[$ptr_dll_name + 4]
    log "Loading '{utf16@$dll_name}'"
    $is_tmp_file = stristr(utf16($dll_name), "Temp\a0")
    cmp $is_tmp_file, 0
    je loop_load
    log "Is temp file"
    $handle_ptr = dword:[esp+0x10]
    log "Handle ptr: {p:$handle_ptr}"
    bpc $load_dll
    ; Use a HW breakpoint to find out when the handle is written
    bphws $handle_ptr, w, 4
    erun
    $handle_tmp_file = dword:[$handle_ptr]
    log "Handle for temp file: {p:$handle_tmp_file}"
    bphwc

bp $unload_dll

loop_unload:
    erun
    $handle = dword:[esp+4]
    log "Unloaded {p:$handle}"
    cmp $handle, $handle_tmp_file
    jne loop_unload

end:
bpc
Once the script is finished, place a Memory Breakpoint on the first section of the game as this is usually where the code is placed:
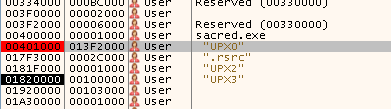
BTW, they named the sections after the typical UPX sections to extra fool us ;)
Let the game run freely and you should break here:
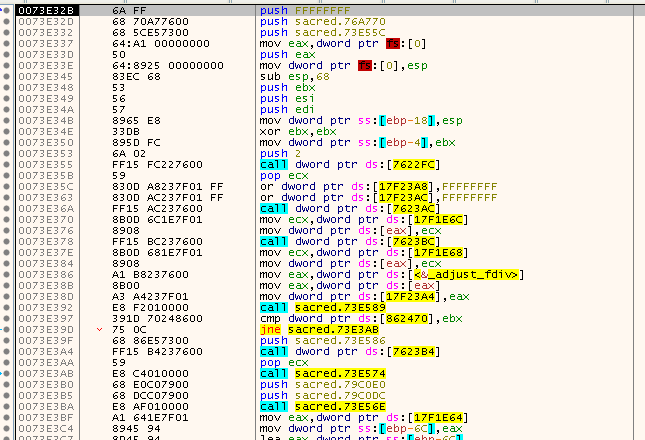
Although the imports are messed up, it looks quite like a typical entry point. Also, we can find the address of EIP as last element on the stack, so the tailjump was probably made by a PUSH XXX; RET combination.
Fixing the imports
Now that we know where the OEP is, let’s have a look at the IAT and the Intermodular Calls. You’ll find that all Intermodular Calls lead to temporary buffers. But instead of acting as a proxy and forwarding the caller to the real proc, we stay in the temporary buffer.
This had me puzzled for a brief moment until I realized that the temporary buffer contains parts of the proc. For example have a look at the import at 0x007622DC it looks something like that:
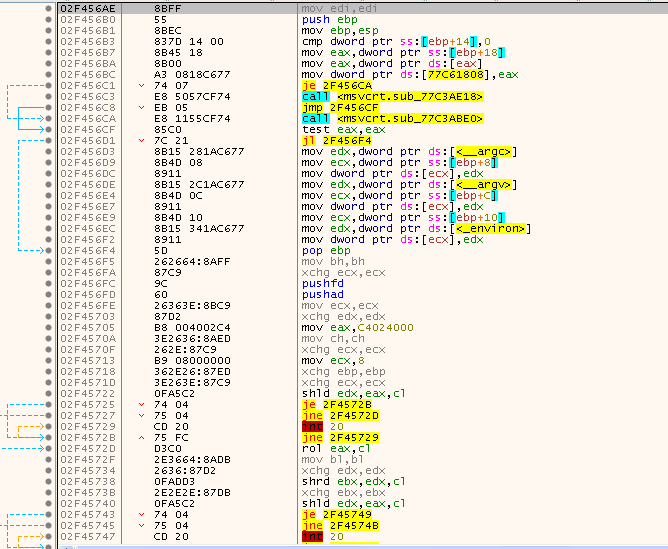
It starts off quite normally, you can see some calls to routines in msvcrt.dll but then the code looks strange and deliberately altered. Via copying the first few bytes of the routine and doing a pattern-search, I was able to figure out that this is actually msvcrt.__getmainargs:
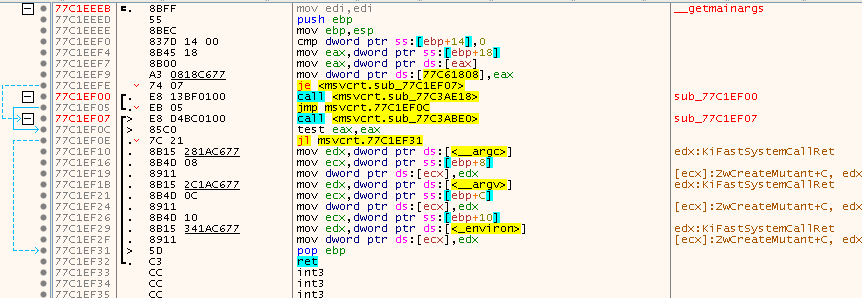
See how it’s pretty much the same routine, but the RET was replaced with a few dummy instructions?
So, what has happened? ProtectCD has copied the code of each import to a local buffer and - sometimes more, sometimes less - added a few dummy instructions. By this, it’s not possible to get the original address of the imported proc by a section-jump etc.
But then how can we figure out the original proc address?
A few moments of trial-and-error later I realized that ProtectCD will always keep the first instruction intact, so it should be possible to ‘fingerprint’ the procs by placing an instruction there that we can identify later. So, my plan was the following:
- Before the loader starts, hook GetProcAddress
- Every time the loader imports a proc, we place an instruction at the start of the proc that holds some ID-value, e.g.
PUSH {ID} - We place the ID-value and the proc-address in a lookup table
- Later, we go through the (altered) IAT, check if there is a
PUSH {ID}instruction at the start of the proc and then just look up the real proc-address via that ID
But now we have a problem. How can we make sure that the program will still function correctly after we’ve added a new instruction? Well, my solution was simple. Instead of placing the instruction in the original proc, I just allocate a temp buffer with the following instructions and return the address of that temp buffer instead. Basicly proxying the call.
PUSH {ID}
ADD ESP, 4
JMP &OriginalProc
Or even simpler, without the need for an ID, by just placing the address of the original proc at the start of the temp buffer:
PUSH &OriginalProc
RET
But ProtectCD had already thought of that:
So, we can not return a ‘fake’ address from the hooked GetProcAddress, we must return an address that’s within the module. What else can we do? Well, we could try to find some code-cave in each module, place the trampoline there and return that address. Or, we just re-use what we already have and simply ‘hook’ each proc via placing a JMP {HOOK} at the start of the proc, but instead of jumping to a Callback function, we jump straight to the Resume/Trampoline code of the hook. By that method we don’t have to hope to find enough code-caves and I already had the hooking-code from previous articles, I just needed to add the option to have no Callback.
So the refined algorithm goes like this:
- Hook GetProcAddress
- Every time the loader imports a proc, we place a hook (with no Callback) at the start of the proc
- We place the address of the trampoline and the original proc-address in a lookup table
- Later, we go through the (altered) IAT, check if there is a
JMP {TRAMPOLINE}instruction at the start of the proc and then just look up the real proc-address via the trampoline-address
That works actually quite great, but after checking the IAT, I realized that eight entries were not fixed properly. What happened?
For some reason, some imports were proxied in a ‘classical’ manner by (probably) placing the following code in a temporary buffer:
PUSH EBP
MOV EBP, ESP
MOV EAX, &OriginalProc
CALL EAX
LEAVE
RET
And then blasting that code with lots of junk code, so ultimately it looks like this:
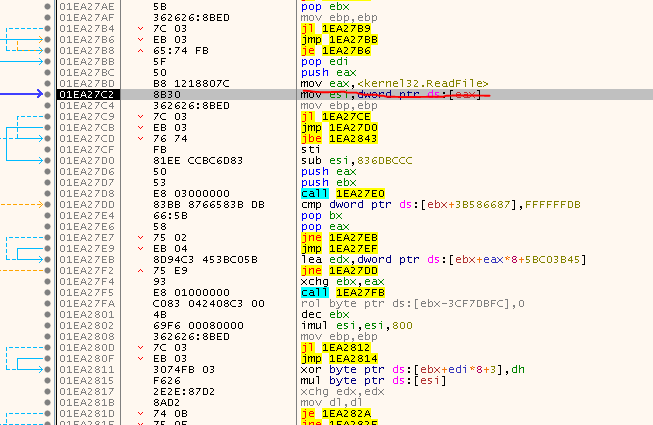
Since I only hat to deal with eight missing imports, I single-stepped through the code and hard-coded the procs in my fixing-routine.
Two imports were self-made recreations of existing procs that just return a const value: GetVersion and GetCommandLineA (those are usually good candidates when trying to find the OEP). I could identify them by their returned value and also hard-coded them. (Se ‘FixIAT’ in Second DLL for more details)
That’s pretty much it, the IAT is fully fixed now and we can dump the game.
As you can see, ProtectCD is not super-duper hard to crack, it just needs a bit of patience and trial-and-error to find solutions for all the little spokes that they tried to put in our wheel.
Custom Protection
When you try to run the game now, it will start without a problem, but there is no sound and as soon as you start a new game, it instantly fades to black. let’s see what’s going on.
The game either detects that it has been cracked or we messed something up.
I must admit that I had a slight hunch where to look, since the crack by SOULDRiNKER comes with a second file, called Base.dll which is just the original renamed game.exe, but I wanted to find the cause on my own.
While digging through the code, I figured out that you can pass multiple command-line arguments to the game, one of which being ‘log’ which will fill the ‘DEBUG.LOG’ file, unfortunately that wasn’t much of a help :(
After a while I got desperate and just placed a breakpoint on each single intermodular call.
By that, I learned, that the game will eventually drop another temp file (like the previous a00xxx.tmp) which will also be loaded by LoadLibraryA and it has also remnants of ProtectCD but it does not look like it will perform any more checks. Just make sure that when the DllMain of said file is called, you have no breakpoints active since it seems like it will copy some stuff to temporary buffers and will crash if an INT3 is detected since the debugger is unable to properly break and repair on breakpoints that it does not know. This is especially the case for breakpoints on some imported procs.
After quite some while of poking in the dark, I came across this location:
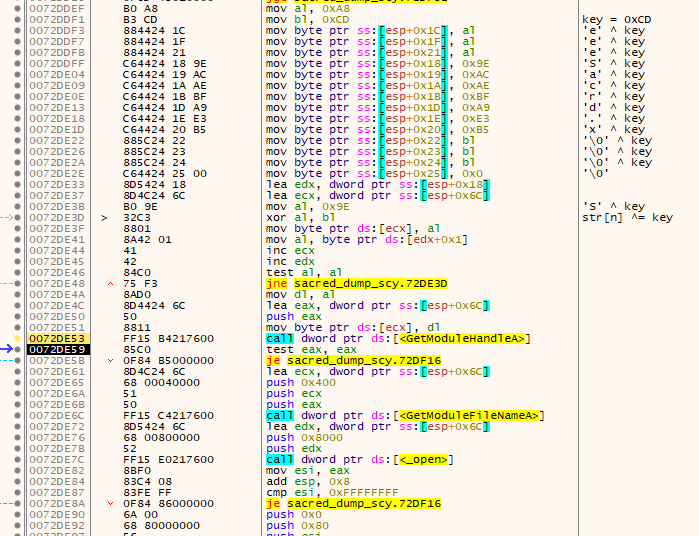
First, it decrypts the string “Sacred.exe” and then tries to get the module handle for that, so basicly the base address for the game. Unfortunately, my dumped game was still called “Sacred_dump_SCY.exe”, since I had dumped it with Scylla previously. So, first realization: The game exe must have the original name “Sacred.exe”!
If it could get the module handle, it will get the filepath of the game via GetModuleFileNameA, read 0x1000 bytes starting from offset 0x80 and compare the first 0x400 bytes against an encrypted copy in a buffer starting at 0x017D4D20.
This buffer is initially empty and will be filled with data from the file ”./PAK/sound.pak” read from file offset 0x000928F0. So they have hidden an encrypted copy of the original exe’s PE Header within the sound files of the game - sneaky ;)
To solve this, we have multiple options now:
- Patch the sound.pak file to resemble the header data from the crack. This would mean the crack would increase by 300MB.
- Write a routine that copies the header data of the cracked exe to the buffer (and encrypt it).
- Patch GetModuleFileNameA to return the path to another file containing the original game exe.
Option three is the simplest of them all, we just need to ‘hook’ GetModuleFileNameA and place the following code there:
DWORD Hook_GetModuleFileNameA(HMODULE hModule, LPSTR lpFilename, DWORD nSize)
{
    if ((hModule == NULL) || (hModule == MAIN_MODULE_HANDLE))
    {
        strcpy(lpFilename, "Sacred.exe.org"); // No need to give full path

        return strlen("Sacred.exe.org") + 1;
    }

    return Trampoline_GetModuleFileNameA(hModule, lpFilename, nSize);
}
The assembly-equivalent that SOULDRiNKER used looks like this:
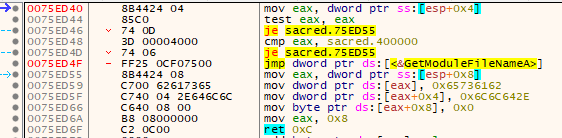
Only that they named it Base.dll and not Sacred.exe.org. The exact name doesen’t really matter I guess, they probably named it Base.dll so it looks more legit and also some Virus Scanners might be happier if a file containing a PE-Header has a ‘.dll’ extension.
That should be it, as far as I can tell, the game now runs without a problem on my Win10 machine. Just make sure to start it in Win XP compatibility mode.
Downloads
In order to crack the game, I used the Simple Injector from previous articles to inject the First DLL in the first game instance. This will then inject the Second DLL into the second game instance and will do the heavy lifting. Check worker_log.txt for some details.
Simple Injector
First DLL
Second DLL
tags: Sacred - Game Cracking - Reverse Engineering - ProtectCD