Stronghold Deluxe
by OldGamesCracking
Game Specs
| Name | Stronghold Deluxe |
|---|---|
| Release-Date | 06/2002 |
| Redump ID | 44042 |
| Protection | SafeDisc v2.60.010 |
| Cracked under | Win XP |
| Tested under | Win XP & Win 10 |
| Scene-Crack by | IMMERSION / MYTH |
Needed Tools:
- Good Old PC (Windows XP)
- x32dbg
- ProcMon 3.1 (Win XP compatible)
- PE tool of your choice (e.g. PE-bear)
- The original Game-CD of course ;)
- Compiler, Dev-IDE and stuff (e.g. VisualStudio)
- The previous articles on SafeDisc
- Kaffee, Kaffee, Kaffee
- w4kfu’s Article was of great help!
Disclaimer
- The games are cracked for educational purpose and to regain compatibility with modern systems
- The games are more than 20 years old and can be found freely on the net via e.g. archive.org
- No parts of the game are distributed
How to Crack
Looking through my game collection, I discovered that Stronghold Deluxe - a kind of expansion pack to the original version - has the version 2.60 of SafeDisc installed.
So it felt natural to have a look at that next.
Starting from this version onwards, SafeDisc gets somewhat trickier. We will see, if we can tackle all aspects of the protection.
If we run the game normally in the VM, everything works fine, but as soon as we let it run in the debugger, it crashes. So it looks like since this version an improved anti debugging scheme was used. Let’s track it down. Interestingly, ProcMon reveals that the game seems to boot up fine in the debugger, but then somewhere crashes down the line. I tried to use ScyllaHide this time but it either crashed or the program seemed to run in some infinite loop.
The infinite loop seemed to be more like some kind of hybernation since the Task Manager indicated no activity, normally you get 100% CPU usage if something ends up in a real infinite loop. This alone should have rang a bell since I had read only a few weeks ago about Armadillo and it’s Nanomites. But I had to dig through the net a bit and after a while found out what’s going on.
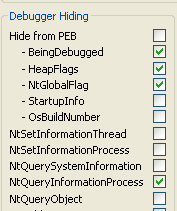
So, lets put a breakpoint on WaitForSingleObject - we will see in a short moment why. Also I found out that you need at least the following Scylla options:
The following script is what I ended up with to break on WaitForSingleObject:
bpc
bphwc

$addr_LoadLibraryA = LoadLibraryA + dis.len(LoadLibraryA)
bphws $addr_LoadLibraryA
bphwcond $addr_LoadLibraryA, "stristr(utf8(arg.get(0)), \"shell32\") == 1"

erun

bphwc $addr_LoadLibraryA

$addr_WaitForSingleObject = WaitForSingleObject + dis.len(WaitForSingleObject)
bphws $addr_WaitForSingleObject
bphwcond $addr_WaitForSingleObject, "arg.get(1) == 0xffffffff"

erun
First, we wait for shell32.dll to be loaded, which I found is a DLL that is loaded somewhat after the game is unpacked and then we wait for WaitForSingleObject with INFINITE as second parameter. If everything works according to the plan, we should break in the temp module of SafeDisc (at 0x1002745A in my case).

With all the jumps, the SafeDisc code is a mess, but if you dig through it a bit, you will find the corresponding CreateEvent a few lines above:

And also a SetEvent, which is actually for another event (compare EBP-0x220 vs. EBP-0x218):

What is that all about you may ask. Well, this is a very tricky debugger check. It relies on the fact that a process can only have one debugger attached to it at a time. If you try to attach another debugger, it fails. The fail/pass information is signaled back to the process via an event. If that event is not signaled, it means a debugger was detected and an infinite loop is created. So it goes something like that:
- The game.exe creates another process, let’s call it debugger.exe (real name is something like ‘~f39a36.tmp’) and passes it’s PID to it.
- The game.exe creates two events. One called ALT_{PID} and the other BLT_{PID}, both un-set initially.
- The game.exe sets the event ALT_{PID} (to signal that it wants to be debugged) and then waits for BLT_{PID} to be set.
- The debugger.exe detects that ALT_{PID} has been set and now tries to attach to game.exe as a debugger.
- Since we already debug the game.exe, the debugger.exe can not attach and thus will never set BLT_{PID}.
- game.exe waits indefinitely for BLT_{PID} to be set and thus hangs.
I’m not 100% sure about the order, but in general it should be correct and you get the idea.
The plan I had now was to just let the game run until it creates the BLT event, then steal the handle, jump to SetEvent and set the event myself :) The script for that looks like the following:
; Find Tail jump
; call eax; popad; pop ebp; jmp ??
find eip, FFD0615DEB
cmp $RESULT, 0
je error_msg
$oep_jmp_offset = byte:[$RESULT + 5]
$oep_jmp_address = $RESULT + 4 + $oep_jmp_offset + 2
$oep_jmp_offset = dword:[$oep_jmp_address + 1]
$oep_address = $oep_jmp_address + $oep_jmp_offset + 5
log "OEP jump at {p:$oep_jmp_address}"
log "OEP at {p:$oep_address}"

; Wait until game is unpacked
$addr_LoadLibraryA = LoadLibraryA + dis.len(LoadLibraryA)
bphws $addr_LoadLibraryA
bphwcond $addr_LoadLibraryA, "stristr(utf8(arg.get(0)), \"shell32\") == 1"

erun

bphwc $addr_LoadLibraryA

; Wait until the second event is created
$addr_CreateEventA = CreateEventA
bphws $addr_CreateEventA
bphwcond $addr_CreateEventA, "stristr(utf8(arg.get(3)), \"BLT_\") == 1"

erun

bphwc $addr_CreateEventA

; Steal the handle
rtr
$event_handle = eax

; Wait for process to wait for event
$addr_WaitForSingleObject = WaitForSingleObject + dis.len(WaitForSingleObject)
bphws $addr_WaitForSingleObject
bphwcond $addr_WaitForSingleObject, "arg.get(1) == 0xffffffff"

erun

bphwc $addr_WaitForSingleObject

; Set the event
$eip_org = eip
eip = SetEvent
esp -= 8
dword:[esp+4] = $event_handle
rtr
esp += 8

; jump back
eip = $eip_org

; We can finally break on the OEP
bphws $oep_address, x, 1

erun

bphwc $oep_address

log "You should be at the OEP now :)"
jmp end

error_msg:
	error "Could not find OEP :("

end:
You can also download the script here.
That worked surprisingly well. One could probably also have altered the parameters passed to WaitForSingleObject or returned prematurely from that. So now that we are at the OEP, it’s time to fix the IAT. I used the following settings for my SafeDisc script:
$iat_start = 0x00556000
$iat_size = 0x00000300
$user_code_end = 0x21100000
But the script failed after some time. Upon inspection I discovered that the IAT was overflowing. So I re-coded parts of the script so that it will now reconstruct the IAT in a buffer first and then repair everything later. That works, but with all the findmemall commands it takes forever (around 2-3 minutes), guess we have to recode parts of it in C++ someday…
With that out of the way, I then tried to run the game but only a few instructions into the game we land on this bit:

which in turn is called from this ‘setup’ function:
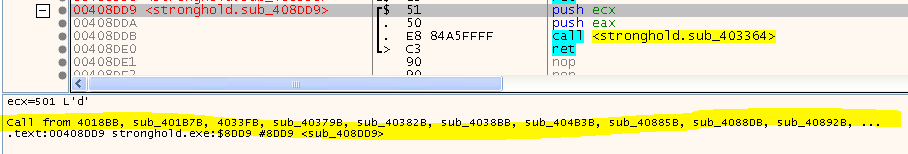
The setup function simply saves EAX and ECX and calls the - how I called it - ‘inner function’. The inner function adds a constant offset to the return value and uses that as a lookup to jump to something we have seen before countless times (if you’ve read the previous articles on SafeDisc):
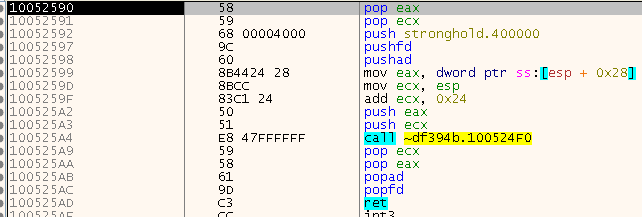
Once the two registers are restored, we end up within the classic stub we all know and love. The stub then resolves to a function somewhere in the user code. So this is basically just a relayed call to some user code.
To fix this, this is what I did:
- Identify the inner function via a pattern
- Get the setup function by going through all calls in the program and see which one calls the inner function
- Go through all calls in the program and see which ones call the setup
- For each of those, resolve the original address via the well known methods described in previous articles
- Patch the CALL to point to the original location
This worked somewhat ok, but things ended up strange, the code was messed up and there were illegal instructions all over the place. Luckily, I remembered the problems I had with GTA 3. There I found out, that a CALL instruction directly below a RET instruction resulted in the game crashing. This time, it did not crash, but the code resolved to garbage. After I ignored these special calls, things started to look normal again.
Time to finally start the game. But wait, what’s that little thing there doing in the code?
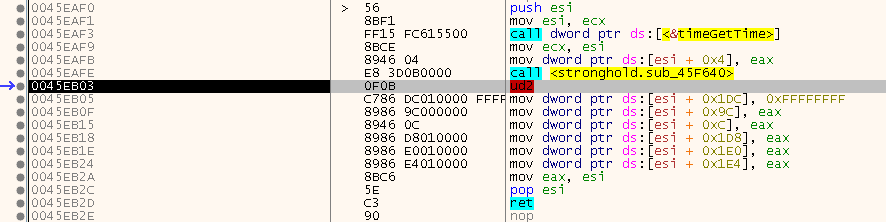
At first I thought I had missed something or my script did not work properly. But it turned out, that even in the un-repaired version of the game, this instruction - which is a Undefined Instruction by the way - is also present. That means that someone had placed it there on purpose. Usually if stuff like this happens, a SEH handler is used to repair the code. But while there was certainly one installed, it was just the generic one that was installed by the game itself which did not manage to resolve this issue. So there must be a much more advanced mechanism going on. Time to go down the rabbit hole - are you prepared?
What are Nanomites?
Remember when I said that the game.exe starts another process (debugger.exe)? Initially I thought that it was only there to stop us from reaching the OEP, but it turns out that it is a much larger part of the protection scheme and observes/controls the game the whole time. The idea is as follows:
- When the game is wrapped in the SafeDisc protection, a few bytes of the original instructions are ‘stolen’ and are then replaced with opcodes that will trigger an exception (INT3, UD2, …).
- The original instructions are placed somewhere deep in the debugger.exe in a lookup table (probably heavily encrypted and shit).
- The debugger.exe attaches to the game.exe and waits for it to trigger such an exception.
- It then looks up the original instruction and a) places it back in the game.exe or b) emulates the instruction by altering the thread context.
As far as I know, this mechanism was (first?) used in the Armadillo Protector where it was called Nanomites, people got used to the name so I will also call it like that.
While option b) is quite tricky to recover, option a) allows you to blackbox large portions of the debugger.exe. Luckily for us, this early version of SafeDisc can be forced into option a), we will see in a short while how this is done. But first, let’s analyze the situation and think about what solution we can come up with.
How to deal with them?
So we can not run game.exe in our (Ring 3) debugger, but we could attach to the debugger.exe and intercept WaitForDebugEvent, WriteProcessMemory, SetThreadContext etc. By a clever setup it should be possible to do all this just with x32dbg and a few scripts. I have not tested it, but this is what I could image that you could do:
- Run the game.exe up until the point where it calls CreateProcess
- Modify the call so it starts the debugger.exe in suspended mode and patch a 0xEBFE to it’s entry point
- Continue the debugger.exe and detach from game.exe
- Attach x32dbg to the game’s debugger.exe and set a breakpoint on WaitForDebugEvent
- Restore the Entry Point and let the debugger.exe continue
- Once WaitForDebugEvent returns, check the DebugEventCode for a EXCEPTION_DEBUG_EVENT, we should be on the first Nanomite now
- Now scan the game.exe memory via ReadProcessMemory and figure out where the next Nanomite is
- Place a breakpoint on WriteProcessMemory to get the replaced opcodes
- Place a breakpoint on SetThreadContext and once you break there, modify EIP to the location of the next Nanomite
- Rinse and repeat
If all original bytes are figured out, we can continue where we left off (at the OEP of game.exe), patch the original bytes and the game is hopefully freed of SafeDisc.
As I’ve said. This should work well, but what if the debugger.exe has also some anti-debugging mechanisms and figures out that we run it in x32dbg? Maybe there is a more stealthy approach - one that makes us also use a real programming language :) Well, ask no more, I present you: DLL-Injections combined with API hooking/detouring. If you want more background info on that topic, search the net, there is lots of information out there and also some quite advanced libraries. But for the general understanding and simplicity, we will stick to the bare minimum and write our own hooking library, it’s actually quite simple.
To honor whom honor is due, I must emphasize that many of the following ideas are based on w4kfu’s article, I just modified them to my needs.
So, instead of just controlling the debugger.exe, let’s also get control of the game.exe. This will also give us the opportunity to automize things a bit.
The rough idea is as follows:
- Inject a DLL in the game.exe
- Once it starts the debugger.exe, inject a DLL into that process also
- Make the game.exe find and execute all the nanomites
- Intercept the calls to WriteProcessMemory in the debugger.exe to get the original bytes
The actual steps are a bit more finicky, but I will go through them one by one. I have also recreated w4kfu’s timing diagram to represent my solution:
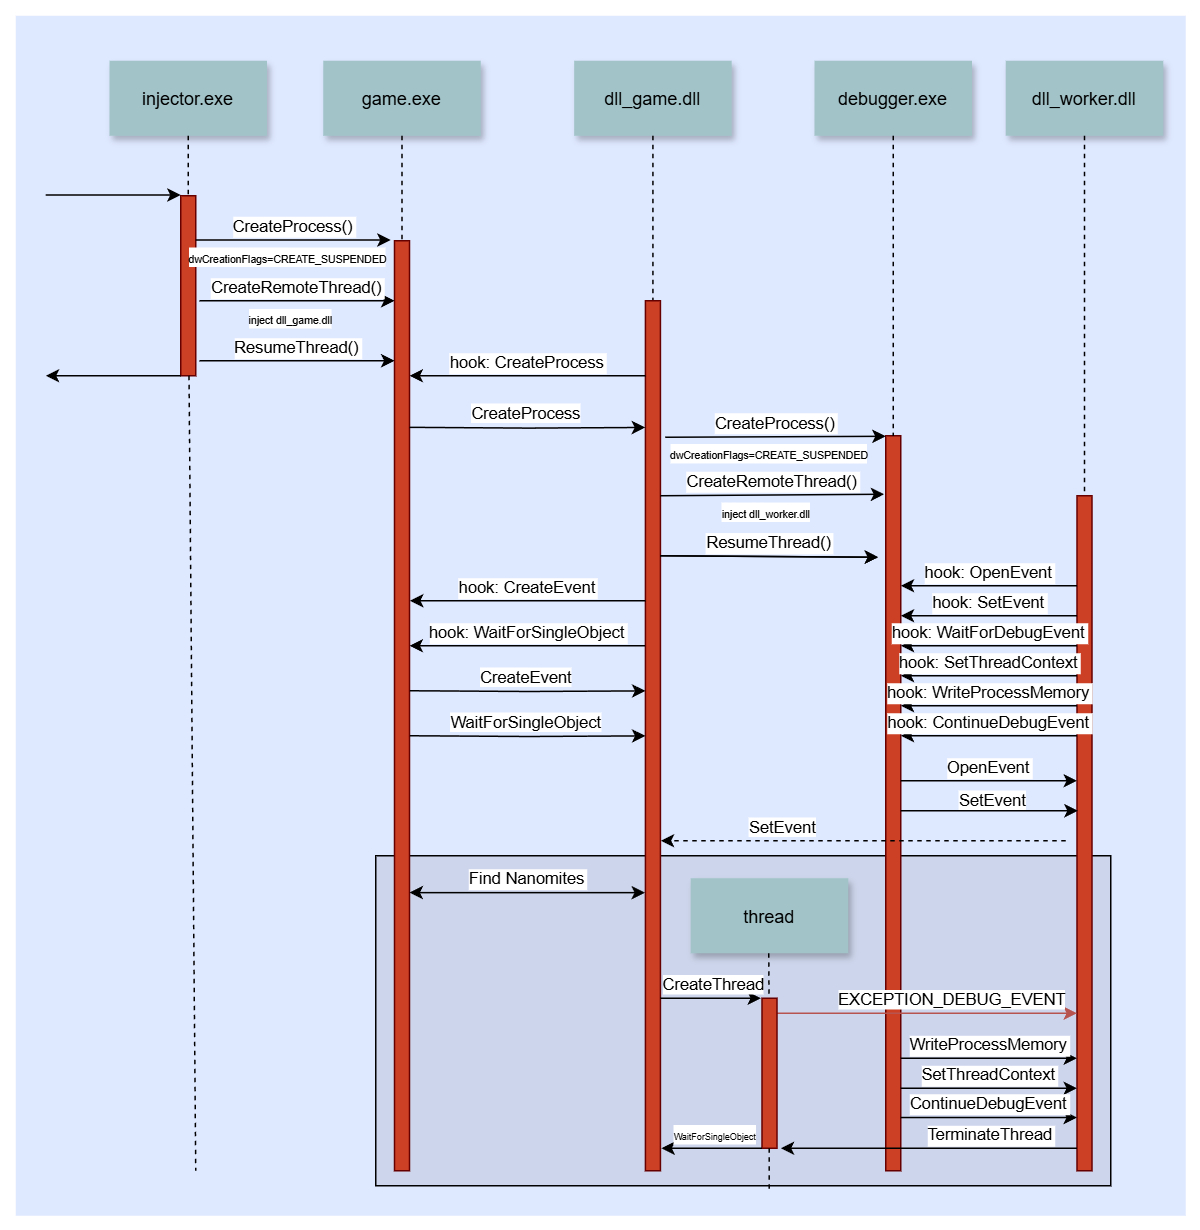
The box at the bottom is repeated for every found Nanomite.
simple_injector.exe
The source code of the injector can be found here.
All the injector does is load the game.exe in suspended mode, inject the first DLL (dll_game.dll) and then start the game.exe. Opposed to w4kfu’s solution, I needed to place a 0xEBFE at the entry point and let the process run a second and then inject the DLL or else the needed modules would not have been loaded, at least under Win XP, this might have been changed in a later Windows version.
dll_game.dll
The source code of the DLL can be found here.
Something I did not talk about before are the types of opcodes we are dealing with that generate an exception. It’s actually not just UD2. To figure out all opcodes, I had first written a very simple dll_worker.dll that would simply monitor the bytes that were replaced while I played the game for a few minutes. I came up with the following opcodes:
0F 0B:  UD2 (Undefined Instruction)
0F AA:  RSM (Resume From System Management Mode)
CD 03:  INT 0x03
CC:     INT3
The first three were easily fixed later and the debugger.exe did not complain, even if the location turned out to be no Nanomite, just had the same byte combination. But 0xCC seems to be special. I had to make sure that it was really an INT3. Every other location containing a 0xCC would stop the debugger.exe from working properly. My guess is that this is some kind of debugger check, to see if there is an INT3 in an unexpected location. I thought a few moments about using a full blown disassembler to properly parse all opcodes in the program, but then skipped the idea and simply used the following script in x32dbg to do the job for me (at the OEP):
analyze
analxrefs

$modbase = mod.base(eip)

findasm "int3", $modbase, 0x00ffffff

$op = 0

loop:
    cmp $op, $RESULT
    jae end
    $addr = ref.addr($op)
    log "0x{p:$addr},"
    $op += 1
    jmp loop

end:
I copied the returned addresses to int3_locations.h which was a great success and the last missing puzzle piece. After that, all Nanomites were restored perfectly :)
Another detail I didn’t mention yet is the fact that some Nanomites are not restored instantly (remember case a) and b) from before?). Luckily SafeDisc will spit them out after the 10th exception. So I added a check to see if the Nanomite was restored or not and if not, I just executed the Nanomite again.
Also, have you already thought about the problem on how to actually trigger the Nanomite to let it get restored? If we would simply point EIP there, we would have no control over the program flow afterwards. At least not easily. One solution could be to patch the call to SetThreadContext in the debugger.exe so that the game.exe gets reset to a known location every time. But there is actually a much simpler solution: Create a new thread on the Nanomite and let it get killed by our dll_worker.dll ;)
One extra detail I added that is not present in w4kfu’s solution is that I spawn a console for the game.exe. This gives a nice debug output and you can monitor the process a bit. Unluckily I was unable to add a console to the debugger.exe, probably because it’s actually a GUI APP.
With these few details you should be able to read the sourcecode on you own ;) Just a short description on what’s going on:
- The DLL is loaded and a thread is created since we should not do anything scary in the DllMain
- In the thread, the console is spawned and the hooks to CreateProcessA, CreateEventA and WaitForSingleObject are set up
- First, the CreateProcessA hook will trigger. If the debugger.exe is detected (name contains .tmp), the dll_worker.dll is injected
- Next, the CreateEventA hook should trigger. If the Event contains BLT (see above), the handle is remembered to identify it in the next hook
- Last, WaitForSingleObject will trigger. If we identify the handle of the BLT event, we know that the game is fully unpacked and we can go on by calling ScanMemory
- In ScanMemory we go through every byte in the text section and check for bytes that could resemble a Nanomite
- For every location we create a thread and wait for it to finish. Depending on the return code (see below), we check if the code has changed (Nanomite was replaced) or we can say that it was probably not a Nanomite
- If the code was not replaced, we re-try for a maximum of 100 times
That’s it ;)
I know that w4kfu has patched the debugger.exe to always repair the Nanomite on the first try, but I was lazy and it really only takes a second to run the code, so there was no need to dig through the riddled SafeDisc code ;)
dll_worker.dll
The source code of the DLL can be found here.
This one is a bit more tricky to understand so I will also outline the inner mechanisms:
- After the DLL is loaded, also a thread is created
- In the thread a debug-log file (worker_log.txt) is created and a file that will contain the restored bytes (restored_bytes.1337), this file is in the patchfile-format of x32dbg so we can simply load it to x32dbg afterwards
- The following functions are hooked: WaitForDebugEvent, SetThreadContext, WriteProcessMemory, ContinueDebugEvent
- First, WaitForDebugEvent should trigger. If an exception is detected, the thread ID is noted down and the variables threadContextSet and processMemoryWritten are reset to false.
- If SetThreadContext is triggered, threadContextSet is set to true (Nanomite was probably only emulated).
- If WriteProcessMemory is triggered, processMemoryWritten is set to true and and also the old and new bytes are written to the patchfile (Nanomite was replaced)
- Finally, ContinueDebugEvent should always get triggered. Depending on threadContextSet and processMemoryWritten it is signalled back to dll_game.dll if the Nanomite was restored or if the address was probably not a Nanomite. In either case the thread is terminated.
Fixup
We now have everything to fully fix the game. The patchfile is in the %temp% folder if you haven’t already figured that out. I found out that it does not seem to matter if we first apply the patches and then let the IAT-fixer script run or the other way round. The only thing that does seem to matter is that we need to rename the gamefile back to Stronghold.exe. If we keep the _dump_SCY suffix that Scylla adds, the game crashes as it does seem to perform some lookups (in the Registry?) based on the name of the executeable.
As always, you can find the version of the script used for this article here.
For anyone playing along at home, this was the patchfile I ended up with.
Thanks for reading, until next time.
tags: Stronghold - Stronghold Deluxe - Game Cracking - Reverse Engineering - SafeDisc