Grand Theft Auto 2
by OldGamesCracking
Game Specs
| Name | Grand Theft Auto 2 |
|---|---|
| Release-Date | 1997 |
| Redump ID | 31547 |
| Protection | SafeDisc v1.30.010 + CD-Checks + Integrity Checks |
| Cracked under | Win XP + Win 10 |
| Tested under | Win 10 |
| Scene-Crack by | Origin / Fairlight |
Needed Tools:
- Good Old PC (Windows XP)
- x32dbg
- The original Game-CD of course ;)
Shoutout to
- Luca D’Amico whote wrote a nice Paper on the topic which I partly used as inspiration.
Disclaimer
- The games are cracked for educational purpose and to regain compatibility with modern systems
- The games are more than 20 years old and can be found freely on the net via e.g. archive.org
- No parts of the game are distributed
How to Crack
For those of you who are playing along at home, try one of the many versions on archive.org, maybe one of them will be identical to mine.
SafeDisc needs a bit of a setup, so first get and old PC with Windows XP or set up a VM and pass through the CD drive. x32dbg will complain, but it will run there.
Load the game in the debugger and we are immedeately busted:
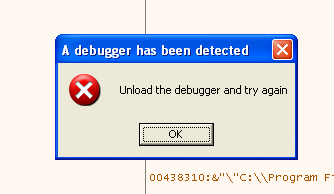
Ok, time to find the places where they found us ;)
Place a Breakpoint directly on MessageBoxA via “bp MessageBoxA” and hope for the best. Ok, we break and according to the message on the stack we are at the right place. Now we make our way up until we reach to a point where the function we are in is either jumped over or not. This is the case at the following location:
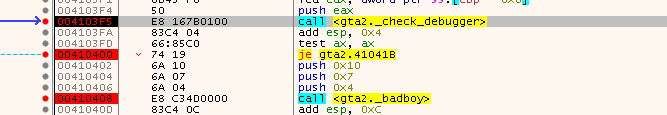
Looks like whatever happens in the call to 0x00427F10 will check for a debugger and if one is detected, we get the badboy message :(
So lets patch the function to always return false:
xor ax, ax
ret
Now we got past the check but the program closes immedeately. So it looks like an integrity check is present somewhere. So we apply the patch but this time we also place a hardware breakpoint “on access” on the first byte of the function. We should break at 0x004159F4, in a function that starts at 0x004159C0 and that seems like it is called for every section.
This probably performs some checksum-checks and if it fails, the program is closed by a yet unknown mechanism.
So we know that the program detects the debugger, but we can not patch-out the check or else the integrity check fails. I tried to write a script that simply changes the value of AX and returns false, but I guess that the check_debugger function does multiple things (maybe counting the number of calls?) so that did not work. Also placing a breakpoint on the end of the function and modifying the return value did not work. So I guess we need to identify the methods that are used to detect us and defy them one by one.
As you probably know, there are multiple techniques to detect a debugger. Some are WinAPI based and some are instruction/behavioral based and some do completely strange things. Let’s first try to find the ones that are WinAPI based as they are often the most simple ones.
For that reason I have come up with a extemely stupid yet effective script that traces through the check_debugger function and loggs all WinAPI calls. It goes something like this:
$addr_IsDebuggerPresent = IsDebuggerPresent
$addr_GetVersionExA = GetVersionExA
$addr_RtlEnterCriticalSection = RtlEnterCriticalSection
$addr_RtlLeaveCriticalSection = RtlLeaveCriticalSection
$addr_GetModuleHandleA = GetModuleHandleA

dotrace:
	ticnd "eip > 0x20000000"

	cmp eip, $addr_IsDebuggerPresent
	je is_IsDebuggerPresent

	cmp eip, $addr_GetVersionExA
	je is_GetVersionExA

	cmp eip, $addr_RtlEnterCriticalSection
	je is_RtlEnterCriticalSection

	cmp eip, $addr_RtlLeaveCriticalSection
	je is_RtlLeaveCriticalSection

	cmp eip, $addr_RtlLeaveCriticalSection
	je is_RtlLeaveCriticalSection

	log "unknown: {p:eip}"

to_user:
	rtu
	jmp dotrace

is_IsDebuggerPresent:
	log "called {p:eip} -> IsDebuggerPresent"
	jmp to_user

is_GetVersionExA:
	log "called {p:eip} -> GetVersionExA"
	jmp to_user

is_RtlEnterCriticalSection:
	log "called {p:eip} -> RtlEnterCriticalSection"
	jmp to_user

is_RtlLeaveCriticalSection:
	log "called {p:eip} -> RtlLeaveCriticalSection"
	jmp to_user

end:
Every time I ended up in the unknown-branch I added a new function and step by step I saw whats going on. Since this would be very labor internsive to pull off manually, I wrote a Python script that generates the x32dbg Script for me, so I basically wrote a script for a script…
At some point things start to get clearer and you see the first interesting calls.
First, there is a GetProcAddress which is always a good sign something strange is going on and if you look at the stack it’s clear that someone is up to no good: NtQueryInformationProcess is imported, you know what that means ;) Keep in mind that NtQueryInformationProcess can - in theory - be used for something other than checking for the debugger so we can not just return zero in all cases. We need to check that ProcessInformationClass is set to 7 (ProcessDebugPort) first. More on that
The next thing I’ve found is a CreateFileA together with “\\.\SICE” or “\\.\NTICE” which is an old technique to detect SoftICE a famous debugger at that time the game came out. You can read more in chapter 3.17 in this paper, since we use a different debugger, this is not of our concern.
I let my script run multiple times since I realized that the check_debugger function was called various times and I expected that it would maybe perform some checks at random so I would not catch everything the first time and I was right. In the second run I discovered that IsDebuggerPresent was imported which can be defeated quite easily by patching the PEB. If the program would check the PEB manually, we would have also evaded that. With x32dbg it’s really easy to do that, just use the following script before you start the game:
$peb_addr = peb()
byte:[$peb_addr + 2] = 0
To get rid of the check done via NtQueryInformationProcess I came up with multiple solutions. In theory you could use a very minimalist version like:
bp NtQueryInformationProcess
bpcond NtQueryInformationProcess, "arg.get(1)==7"
SetBreakpointCommand NtQueryInformationProcess, "$pi = dword:[esp+0x0C];rtr;dword:[$pi] = 0;erun"
SetBreakpointFastResume NtQueryInformationProcess, 1
SetBreakpointSilent NtQueryInformationProcess, 1
This makes use of the special conditional Breakpoints and also adds a ‘Callback’, but I had problems with that later down the line, so I opted for a more explicit version and also used hardware breakpoints to hide the debugger even more (although not needed):
$addr_NtQueryInformationProcess = NtQueryInformationProcess + 2

bphws $addr_NtQueryInformationProcess, x, 1
bphwcond $addr_NtQueryInformationProcess, "arg.get(1)==7"
SetHardwareBreakpointSilent $addr_NtQueryInformationProcess, 1

loop:
	erun
	cmp eip, $addr_NtQueryInformationProcess
	jne end
	$pi = dword:[esp+0x0C]
	rtr
	dword:[$pi] = 0
	jmp loop

end:
Now that the debugger checks seem to be gone, we need to find the OEP jump. One classic way to do that is to find stuff that is going on just before the OEP jump like allocating/writing/protecting memory or re-creating the imports. So let’s monitor some common functions for that via a simplified version of the API hooks described earlier. After quite some while of digging around, I noticed, that one of the last calls before the game starts is CreateFileA with GTA2.icd as parameter. So let’s try to track the exact location down.
By the way, did you have a closer look at GTA2.icd already? You will find out quite fast that it is a valid PE file and you can even open it up in x32dbg but the code at the EntryPoint is all messed up, so my guess at that point is, that it is the game executeable but with encrypted/mangled parts that will later be restored by the Safedisc loader. You can even see some of the imports already, so it looks like it is only partially messed up.
Anyways, to load and start another executeable from a process, one needs to call CreateProcess so we should set a breakpoint on that and hope for the best (with the anti-anti script running in the background). By the way: Some packers will have a look at the first byte of common WinAPI functions to see if a snoopy cracker has placed a breakpoint there (some even check multiple bytes, but that’s not the case here). So to be extra cautious, place the breakpoint at the second instruction in the function. Most of the time this is at a byte offset of two; if not, x32dbg lets you check the size of the instruction via “dis.len(addr)”. Again, a hardware breakpoint should be used.
To pull that off, simply type:
bphws CreateProcessA + 2
Or to make it more general:
bphws CreateProcessA + dis.len(CreateProcessA)
Hit F9 and… well, that did not work according to the plan. Safedisc uses a driver which is also spawned via CreateProcessA and we get hundrets of hits, so we need to fine-tune the command:
bpc
bphwc

$addr_CreateProcessA = CreateProcessA + dis.len(CreateProcessA)
bphws $addr_CreateProcessA
bphwcond $addr_CreateProcessA, "strstr(utf8(arg.get(0)), \"GTA2.ICD\") == 1"

$peb_addr = peb()
byte:[$peb_addr + 2] = 0

$addr_NtQueryInformationProcess = NtQueryInformationProcess

bphws $addr_NtQueryInformationProcess, x, 1
bphwcond $addr_NtQueryInformationProcess, "arg.get(1)==7"
SetHardwareBreakpointSilent $addr_NtQueryInformationProcess, 1

loop:
	erun
	cmp eip, $addr_NtQueryInformationProcess
	jne end
	$pi = dword:[esp+0x0C]
	rtr
	dword:[$pi] = 0
	jmp loop

end:
With this condition we only break if the filename contains “GTA2.ICD” (which I figured out by printing all parameter of all calls to CreateProcessA).
As a short sidenote: I know that Safedisc will start the Process directly from the unaltered file from disc and needs to alter it later via WriteProcessMemory so we could place a BP on WriteProcessMemory right away, but in theory it could have created an unscrambled file from somewhere else (like a malware dropper does) so only a call to CreateProcessA would be needed, hence we go this slightly longer route.
But now back on topic. Let the new script do the heavy lifting for us and wait for the BP to hit. Once we are there, let’s have a look at the parameters on the stack.
lpApplicationName is set to the ICD file in the game-dir so it does not look like a temporary file is generated or somthing like that. Also doing a short checksum-check if needed reveals that the file was not changed, so it is still mangled up as it was before. dwCreationFlags is set to 0x34 (DEBUG_ONLY_THIS_PROCESS | CREATE_NEW_CONSOLE | CREATE_SUSPENDED). The most important part here is CREATE_SUSPENDED which means that there probably needs stuff to be done before it can be resumed.
Now it’s time to find the place where things are un-mangled. In order to do so, typically WriteProcessMemory is used to alter the memory of a process and SetThreadContext to change the registers, for example to change the EIP register to create a new EntryPoint on the go.
So let’s adjust the script and break at WriteProcessMemory and SetThreadContext instead of CreateFileA.
We should break on SetThreadContext first. To see the EIP register we can use the following command:
$ctx = dword:[esp+0x8]
$eip = dword:[$ctx+0xb8]
log "Eip: {p:$eip}"
Which gives us the place of the first instruction when the process resumes. It is set to 0x0012FF77 which differs from the EntryPoint that we can figure out with any PE Tool (0x005E74D0). Hit F9 and you break in WriteProcessMemory. On the stack we find the location where the data is written: 0x0012FF3F, hence a few bytes before the address where Eip points to. If you want to have a look at the code, simply type the following in the console:
disasm dword:[esp+0xc] + (0x0012FF77 - 0x0012FF3F)
Of course this is what the spawned process will see and execute later, not our Safedisc-Loader process we are currently debugging! 0xB5 (181) bytes is a surprisingly low number and moreover this is the only time WriteProcessMemory is used. That means that the code at the EntryPoint is probably decrypted by the stub that we just happed to write to 0x0012FF3F.
Now comes the hard part: We need to attach a debugger to the game process that will be started in a few moments. If the 181 bytes that are written to the process would only contain assembly instructions, we could probably dump and copy them to the file on disc, but since the Safedisc loader has made some imports and included them in the bytes, they would be lost/meaningless and we wouldn’t know which functions are called. Problem is, if we would let the game run freely, the OEP will be gone. Also, attaching to the process in the suspended state is possible, but once we resume it, the program crashes. I have no idea why it is like that. Probably because the imports are not loaded at that state or something like that. So we need to find something else. One solution is to put the process in a controlled endless loop so it will not go anywhere. The instruction for this is simply a “JMP SHORT -2” or EB FE in hex. If we would put this at the place where Eip points to when the process starts it should loop forever, waiting for us to attach to it and patch in the original bytes. Unluckily I’ve spent a very long time figuring out why that does not work either. It always went down the wrong path:
Normally it should take the blue path, but it always took the jump to the end and I have no idea why. My best guess is that “dplayerx” (the Library that is loaded) is not available anymore once we we have started the second debugger or it detects that we attached to the process and now does strange things or something like that.
Anyways, the trick is to simply put the waiting loop at the end of the stub in place of the ret so the party is already over when we arrive ;).
After attaching, pause the debugger (via a BP in the JMP) or it will immedeately start to go on with the execution once we have restored the original bytes. Then place a breakpoint on the OEP (the original EntryPoint you can see in any PE Viewer -> 0x005E74D0) or get it via “bp mod.entry(mod.main())” then replace the loop with the original bytes and finally hit F9 to land at the OEP ;)
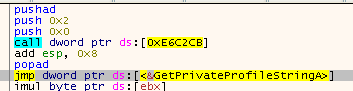
Opening Scylla reveals that most imports are already correct, but there 121 broken ones. They have probably been replaced by stubs. Step into a few (by setting the Eip there) and you should realize that it always works in the same manner. First a pusha, then two values are pushed, then a CALL follows and once we are back from the call, the JMP afterwards will be propagated with the original address of the import.
Before:
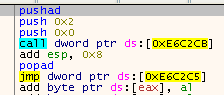
After:
Well, that looks simple enough to build a nice script that basically does what we just did manually:
- Move Eip to the start of the stub
- Step-Over until we land on a JMP
- Do the JMP
- Write value of Eip to IAT
This is what I came up with. You only need to plug in the IAT address and size that Scylla told us:
$iat_start = 0x005F5FFC
$iat_size = 0x0000037C

$iat_end = $iat_start + $iat_size
$fixed = 0

$origin = eip

loop:
    cmp $iat_start, $iat_end
    je end
    $target = dword:[$iat_start]
    cmp $target, 0
    je next
    cmp $target, 0x60000000
    ja next
    $rva = $iat_start - mod.main()
    ; Check if reachable
    cmp mem.valid($target), 1
    jne next
    ; Check if import routine -> has 'pusha' at start
    $ispushad = streq(dis.mnemonic($target), "pushad")
    cmp $ispushad, 1
    jne next
    ; Execute that routine
    eip = $target
    ; Step-Over until 'jmp'
    do_import:
        $isjmp = streq(dis.mnemonic(eip), "jmp")
	    cmp $isjmp, 1
        je import_done
        sto
        jmp do_import
    import_done:
    ; execute the jmp
    sti
    $fixed += 1
    log "Fix #{u:$fixed}: VA:{p:$iat_start}, RVA:{p:$rva} -> {p:$target} ->{p:eip}"
    dword:[$iat_start] = eip

next:
    $iat_start += 4
    jmp loop

end:
    eip = $origin
Finally we have a fully unpacked Game Exe, time to test it without the CD ;)
But wait, there is more
Under Windows XP the game has some issues which seem to come from the OS itself not the Game but it turns out that it’s working fine under my Windows 10, but wait a minute. What is that?

(Please insert disc)
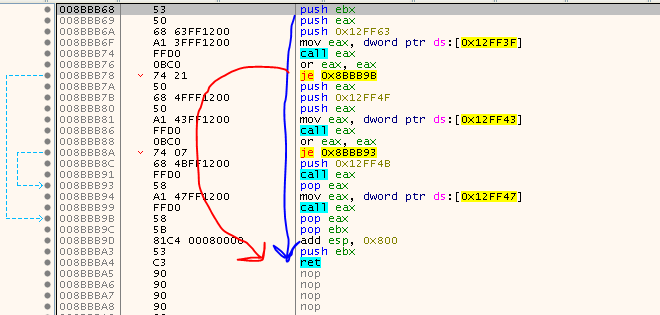
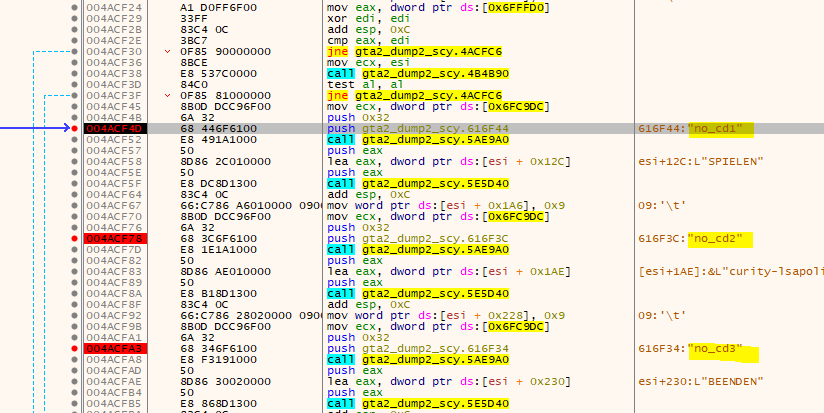
Looks like they added some more CD-Checks. Probably it’s the same as with GTA 1 in that they left the music on the CD and only the nessecary game files are installed to the hard drive. Ok, so open our new executeable in x32dbg and have a look around. I immedeately found three strings “no_cd1,2,3” that caught my attention. So put a BP on them and restart the game. We break and we see two jumps:
If you patch the first one you put the Game in some Multiplayer mode so this does not seem to be correct. It’s probably the function at 004B4B90 that’s checking for the CD. Patch it so it returns always true:
mov al, 1
ret
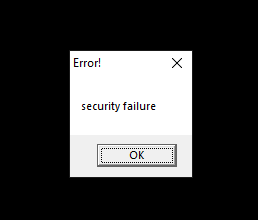
Now we can start the menu, but as soon as we start the game, we get a warning message:
So either the disc is important for the game since it needs some files or it has simply detected that we patched it. Time to figure it out :) Place a BP on MessageBoxA and restart. Aha, we break and see the message on the stack - bingo. Making our way up the call stack we realize that we are in a function that starts at 0x004A10B0. This function is called from many many places, so it’s probably some generic MessageBox helper function which also shuts down the game. Going one step further up the call stack we see the integrity check:
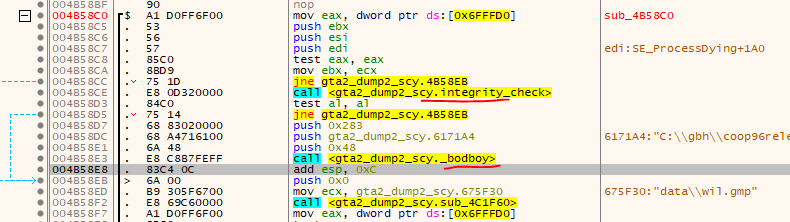
We restart the game, patch out the integrity check and can finally start to play. Or can’t we? The game now loops and plays the same sound all over again. Ok, maybe there is more going on. Have a closer Look at the CD-Check function and the integrity check function. They both kinda look similar. They both have this interesting compare and then some timing stuff. Lets see where this function (timeGetTime) is called also.
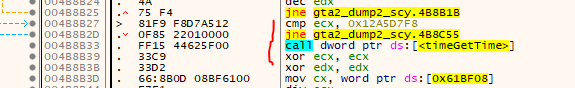
From the pure look of it, it looks like the function at 0x004B8DC0 is very similar, it also uses the same value at 0x0061BF08 (whatever that is). So just for the fun, lets also patch that function to always return true.
The Game seems to run now, but something is still odd. I get no damage and other stuff is strange. But I don’t know if this is due to some incompatibilities with modern systems or if they detected the presence of a crack. At that time I decided to keep it that way and go on with other games.
For the record, here are the patches I applied:
000B4B90:81->B0
000B4B91:EC->01
000B4B92:20->C3
000B8AE0:81->B0
000B8AE1:EC->01
000B8AE2:20->C3
000B8DC0:81->B0
000B8DC1:EC->01
000B8DC2:20->C3
000D55F0:83->B0
000D55F1:EC->01
000D55F2:18->C3
tags: GTA2 - Grand Theft Auto 2 - Game Cracking - Reverse Engineering - SafeDisc